⭐ Start off 2025 with a powerful boost to your portfolio: January’s freshest AI-picked stocksUnlock stocks

SPX: What's In Store For The 2020s And 2030s?

Published 12/29/2019, 12:58 AM
Updated 07/09/2023, 06:31 AM
US500
-
IXIC
-
XLK
-

Each candle on the following chart of the S&P 500 represents a period of one year.

From 1932 to 1972, it, essentially, rallied for 40 years, particularly for the latter 30 years. From 1974 to 2000, its bull run lasted for 26 years. For the past 10 years, it's also been in a strong bull market.

Very simply, history shows that, for the most part, the SPX has been a strong (BUY) candidate for longer-term investors over an average of 30 years running, and that is likely to be repeated for another 10-20 years, generally speaking.
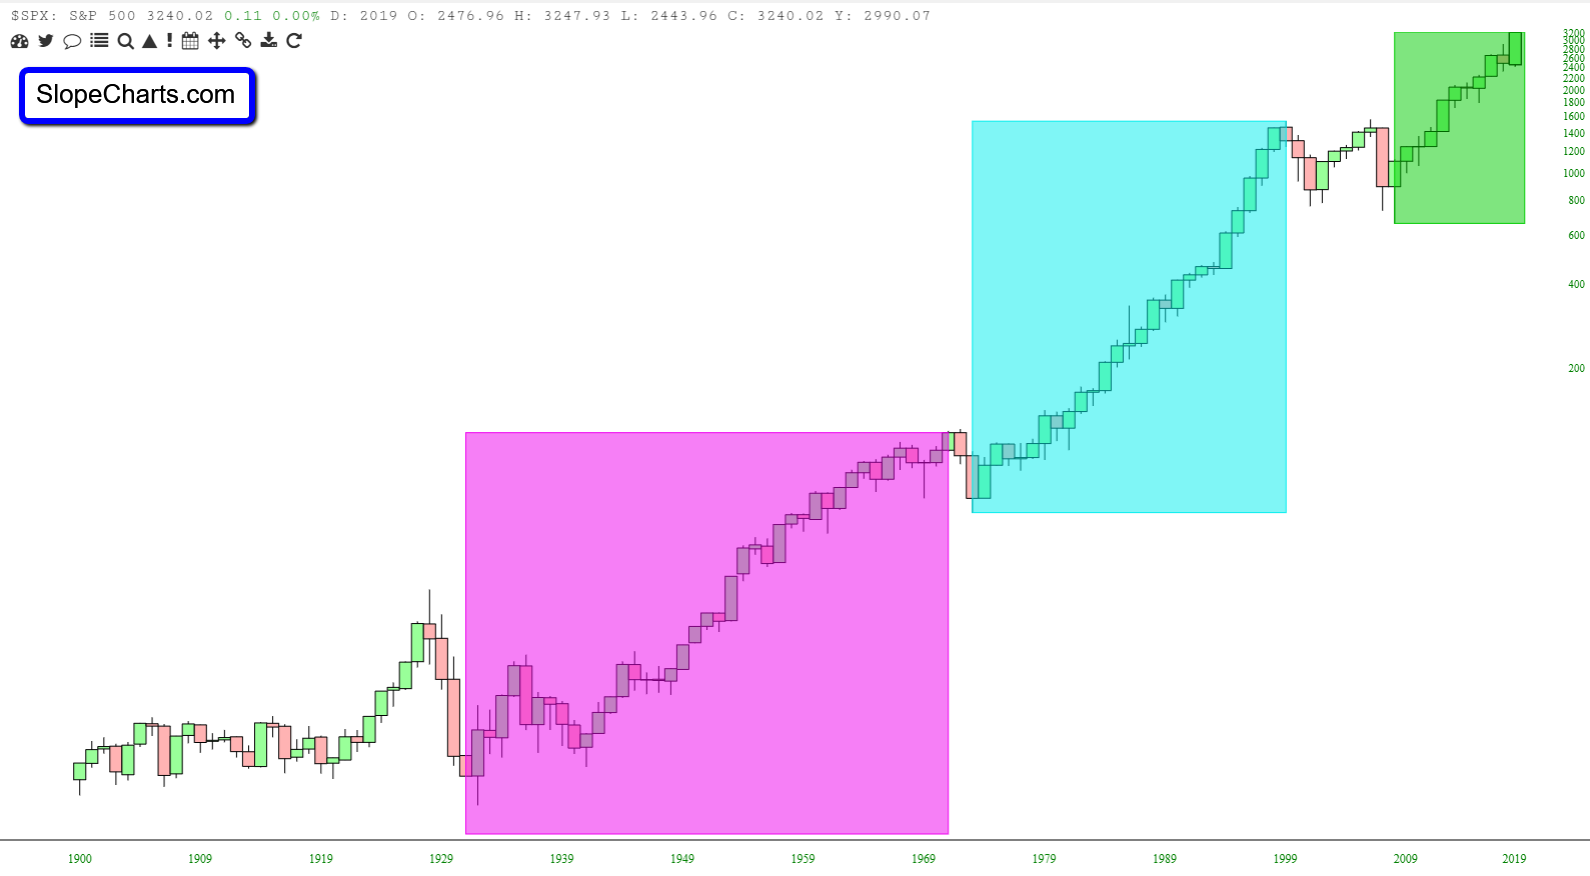
SPX Yearly Chart

As I write this post on December 28 (with only 2 trading days left in 2019), the following monthly chart of the SPX shows that it has gained 340% from its March 2009 lows.

The Balance of Power is currently under the control of buyers and has yet to match prior highs...hinting of further upside potential for 2020.

Furthermore, if the 2020s are as strong as the 2010s, look for a similar percentage gain through to 2030...and, possibly again to 2040...before we eventually see a meaningful pullback/consolidation for, perhaps, 10 years through to 2050.
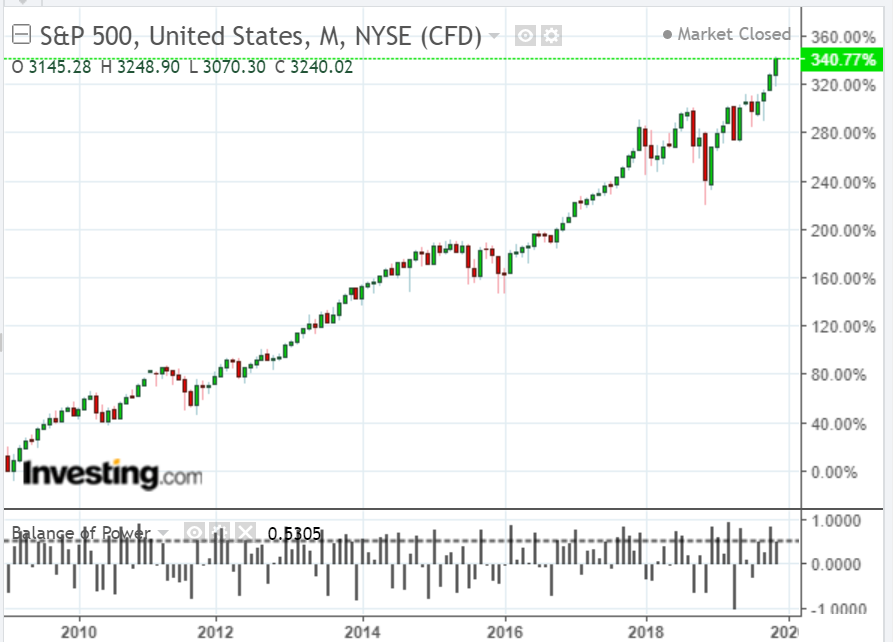
SPX Monthly Chart

As long as the Technology Sector (NASDAQ Composite Index) remains strong through 2020, as I wrote in my post last week, no doubt that will bode well for the SPX.

The following monthly chart shows a gain of 554% for the past 10 years. The gains in the tech sector have outpaced the U.S. markets, in general. That is likely to continue and, possibly, strengthen over the next 10 to 20 years as innovation accelerates...buoying the rest of the markets, in turn...one to watch!
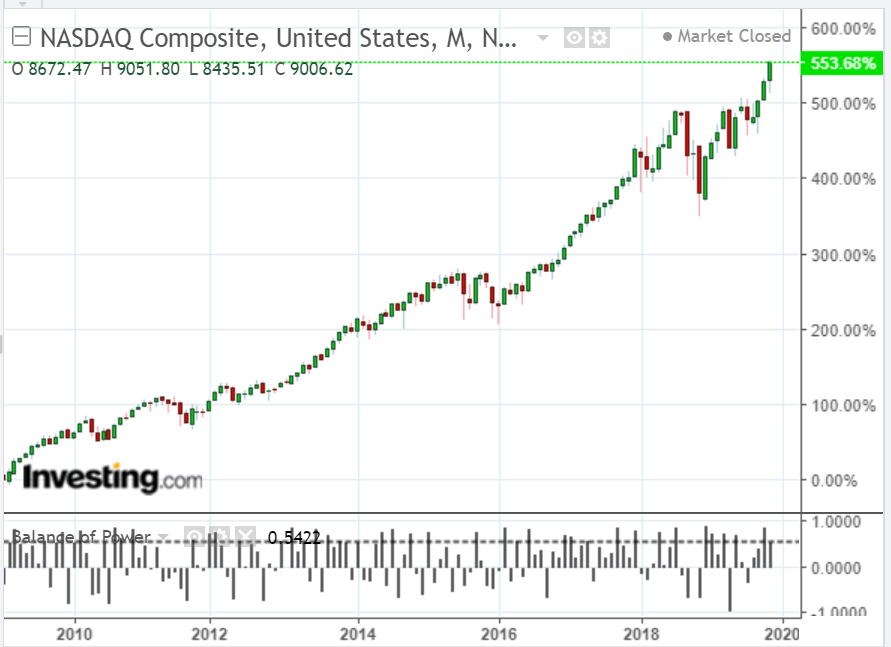
Nasdaq Comp Monthly Chart

Latest comments

Loading next article…
Risk Disclosure: Trading in financial instruments and/or cryptocurrencies involves high risks including the risk of losing some, or all, of your investment amount, and may not be suitable for all investors. Prices of cryptocurrencies are extremely volatile and may be affected by external factors such as financial, regulatory or political events. Trading on margin increases the financial risks.
Before deciding to trade in financial instrument or cryptocurrencies you should be fully informed of the risks and costs associated with trading the financial markets, carefully consider your investment objectives, level of experience, and risk appetite, and seek professional advice where needed.
Fusion Media would like to remind you that the data contained in this website is not necessarily real-time nor accurate. The data and prices on the website are not necessarily provided by any market or exchange, but may be provided by market makers, and so prices may not be accurate and may differ from the actual price at any given market, meaning prices are indicative and not appropriate for trading purposes. Fusion Media and any provider of the data contained in this website will not accept liability for any loss or damage as a result of your trading, or your reliance on the information contained within this website.
It is prohibited to use, store, reproduce, display, modify, transmit or distribute the data contained in this website without the explicit prior written permission of Fusion Media and/or the data provider. All intellectual property rights are reserved by the providers and/or the exchange providing the data contained in this website.
Fusion Media may be compensated by the advertisers that appear on the website, based on your interaction with the advertisements or advertisers.
© 2007-2025 - Fusion Media Limited. All Rights Reserved.