⭐ Start off 2025 with a powerful boost to your portfolio: January’s freshest AI-picked stocksUnlock stocks

S&P 500 'Shock Event' As Volatility Rises

Published 01/31/2018, 12:17 AM
Updated 07/09/2023, 06:31 AM
US500
-
SVXY
-
VIX
-

I last wrote about volatility (SPX:VIX ratio) in my post of just a few days ago.

Yesterday, the major indices gapped down at the open and closed near their lows. Here's how the S&P 500 Index (SPX) closed, with the VIX overlayed (daily chart).
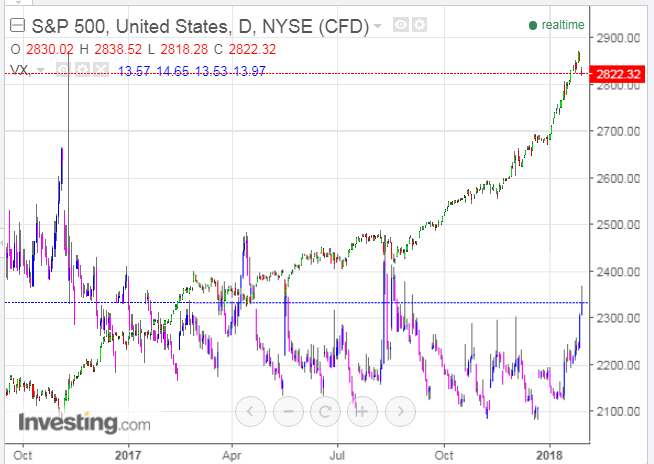
SPX:VIX Daily 2016-2018

This monthly chart of the SPX:VIX ratio shows yesterday's close below major support of 200.

The momentum indicator has fallen to just above the zero level on this timeframe...a drop and hold below would indicate increased selling pressure in equities.
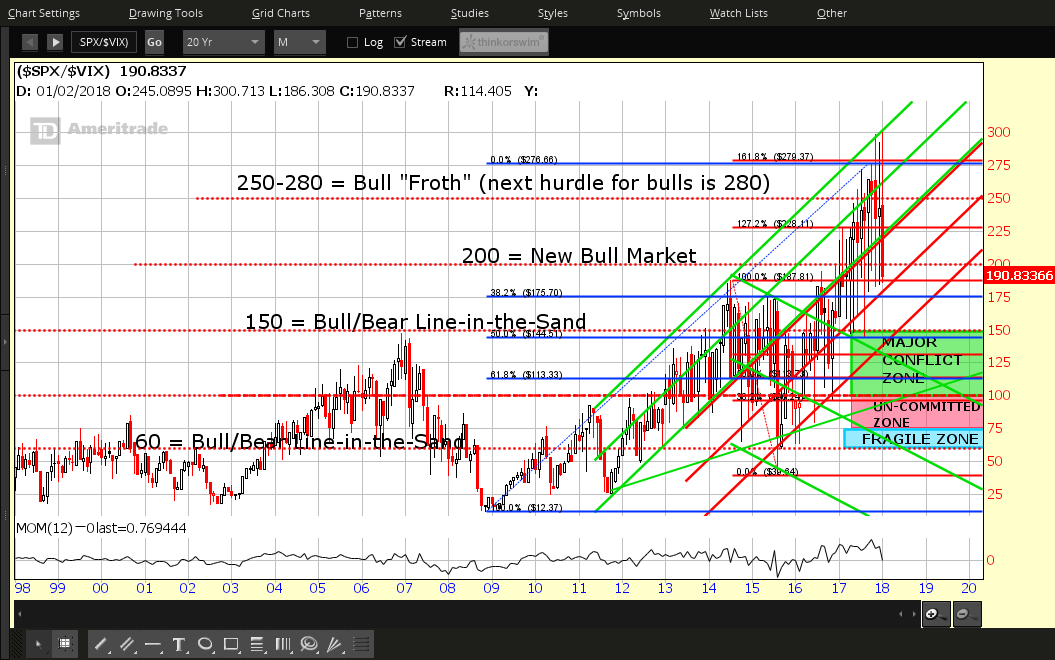
SPX:VIX Monthly 1998-2018

And for a slightly different perspective, the last monthly chart depicts the SPX in the upper half and the SPX:VIX ratio (in histogram format) in the lower half). Price on the ratio has fallen below the 20-month moving average (yellow)...hinting of further weakness ahead.


I'll provide an update on where the monthly candle closes on this ratio in relation to major support, its momentum, and the moving average at the end of today's month-end trading, so stay tuned.
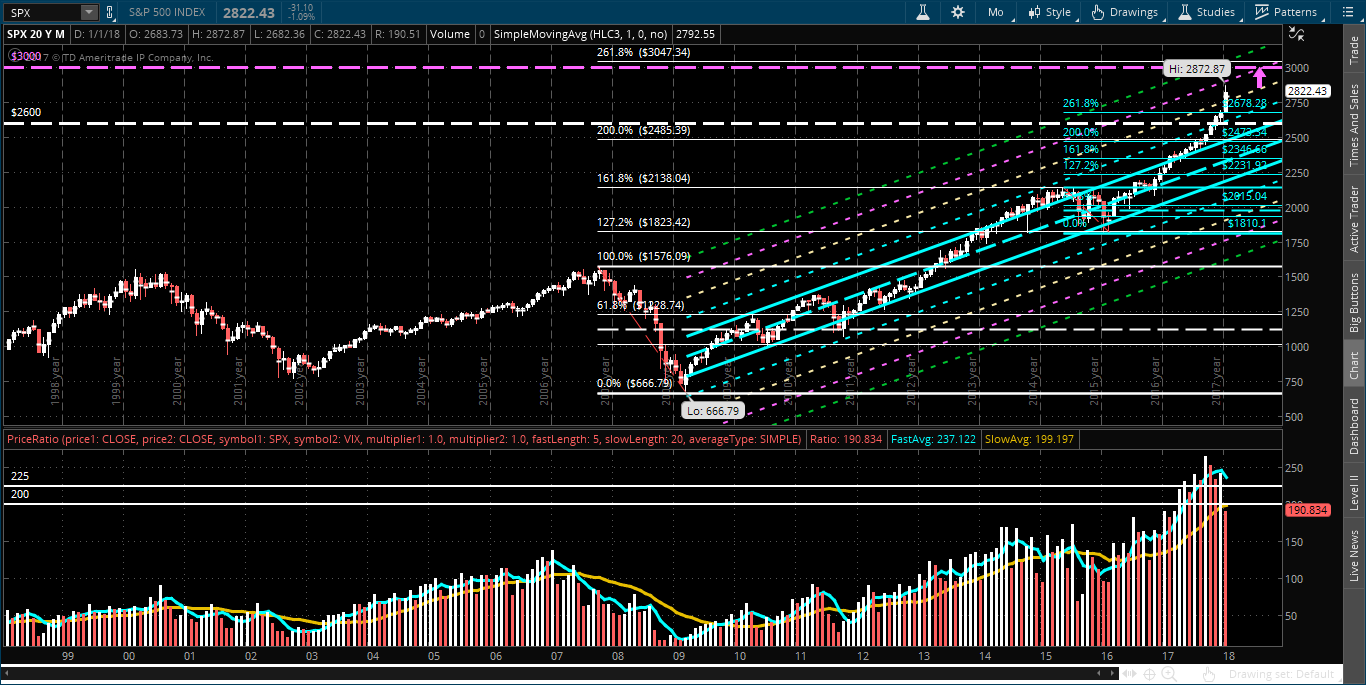
SPX Chart

P.S. Throw a little news into the mix regarding volatility...
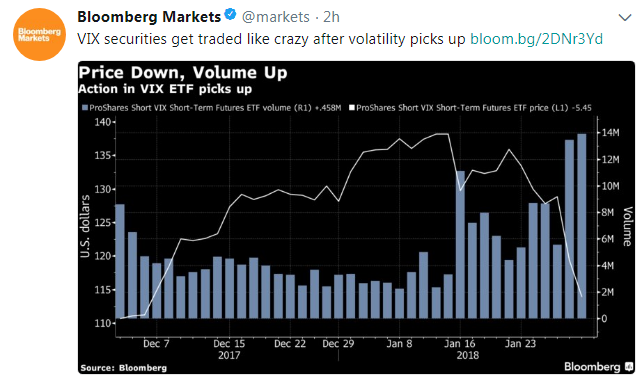
SVXY Daily


...plus the fact that the U.S. was not the only world market to be hit in yesterday's large-scale sell-off...and we'll likely witness some interesting action today, world-wide.
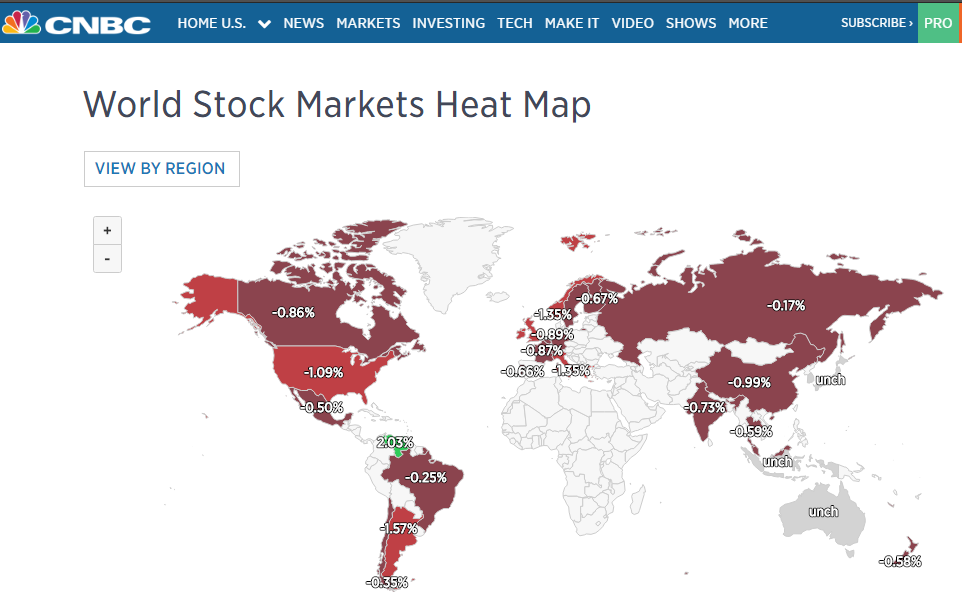
World Stock Markets Heat Map
Source: CNBC.com

Latest comments

Loading next article…
Risk Disclosure: Trading in financial instruments and/or cryptocurrencies involves high risks including the risk of losing some, or all, of your investment amount, and may not be suitable for all investors. Prices of cryptocurrencies are extremely volatile and may be affected by external factors such as financial, regulatory or political events. Trading on margin increases the financial risks.
Before deciding to trade in financial instrument or cryptocurrencies you should be fully informed of the risks and costs associated with trading the financial markets, carefully consider your investment objectives, level of experience, and risk appetite, and seek professional advice where needed.
Fusion Media would like to remind you that the data contained in this website is not necessarily real-time nor accurate. The data and prices on the website are not necessarily provided by any market or exchange, but may be provided by market makers, and so prices may not be accurate and may differ from the actual price at any given market, meaning prices are indicative and not appropriate for trading purposes. Fusion Media and any provider of the data contained in this website will not accept liability for any loss or damage as a result of your trading, or your reliance on the information contained within this website.
It is prohibited to use, store, reproduce, display, modify, transmit or distribute the data contained in this website without the explicit prior written permission of Fusion Media and/or the data provider. All intellectual property rights are reserved by the providers and/or the exchange providing the data contained in this website.
Fusion Media may be compensated by the advertisers that appear on the website, based on your interaction with the advertisements or advertisers.
© 2007-2025 - Fusion Media Limited. All Rights Reserved.