Higher Volatility Threatens The S&P 500: Important Levels To Monitor

Published 01/29/2018, 06:31 AM
Updated 07/09/2023, 06:31 AM
US500
-
XHB
-
HYG
-
VIX
-

In my 2017 Market Wrap-Up post, I referenced major support (200) and resistance (280) as levels worth monitoring on the SPX:VIX ratio, on a monthly timeframe.

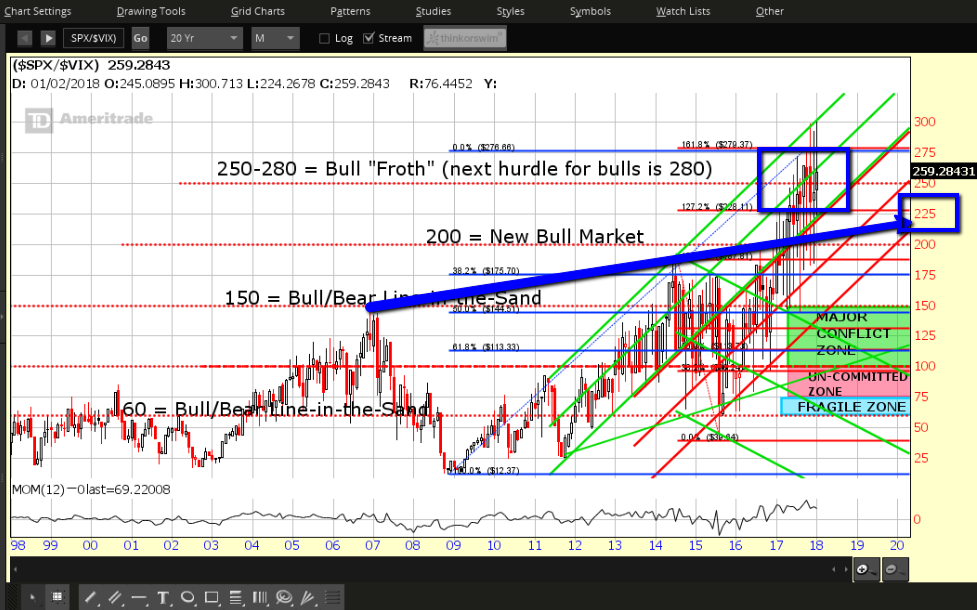
The following updated monthly chart of the SPX:VIX ratio reveals a few interesting things:

  1. All of the monthly closes since July 2017 have been above 225.
  2. December '17 and January '18 have spiked above the 280 resistance level, but not yet held above.
  3. A long-term uptrend line (heavy blue arrow) indicates near-term support around 225, at the moment.
  4. 225 is confluent with a major external Fibonacci retracement level at 228, as well as the bottom of the original long-term uptrending (green) channel.
  5. In my post of February 24, 2017, I identified 200 as a new level to be held above, in order to support a new bull market in equities.
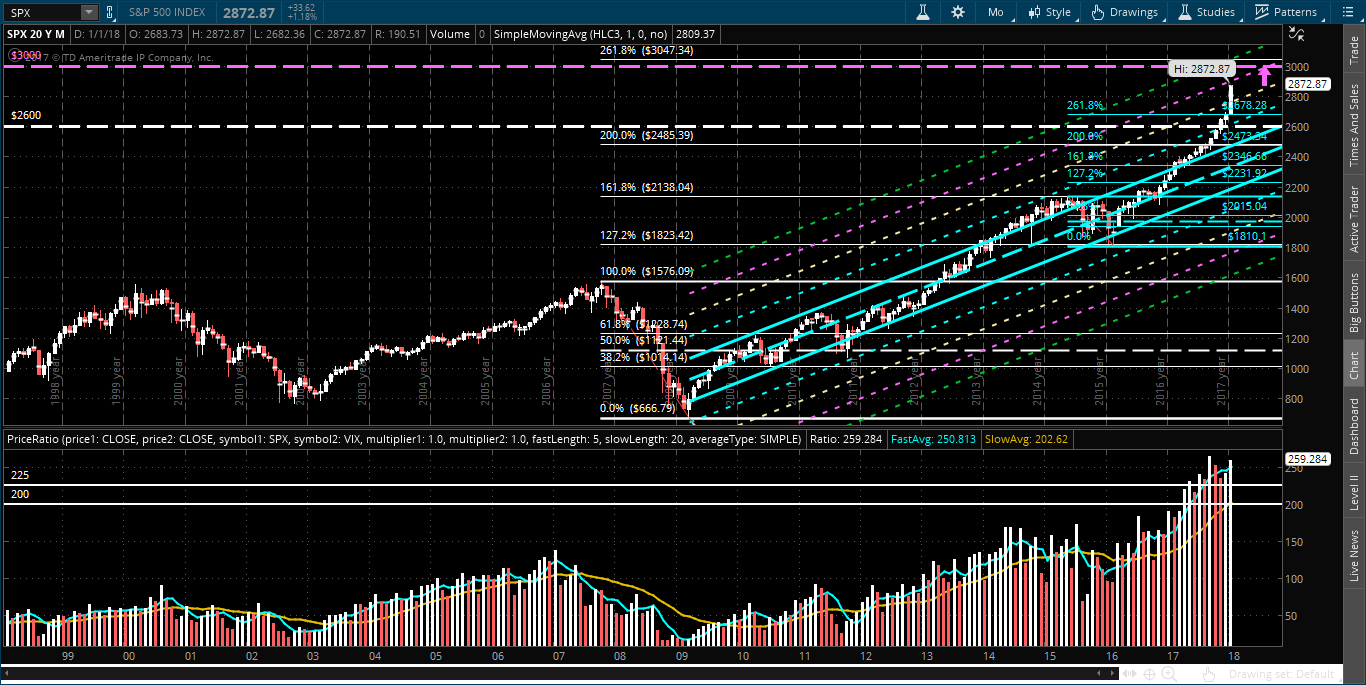
  6. In April, 2017 we started to see closes above 200 (the next monthly chart shows the SPX in the upper half and the monthly closes (in histogram format) of the SPX:VIX ratio in the lower half, for a different perspective).
  7. Monthly momentum on the SPX:VIX ratio began to weaken last November, which hasn't supported the price breakout on the SPX above 2600.

From these observations, I'd make the following statements (based on a longer-term monthly timeframe and outlook):

  1. Watch 225 closely on the SPX:VIX ratio to see if price can continue to close above that level.
  2. If so, I'd need to see the momentum on this ratio strengthen, again, to support higher SPX prices.
  3. If we don't see a reversal in momentum, it's doubtful that the SPX will reach a target price of 3000 anytime soon, as I had described in my post of January 23.
  4. If price on this ratio falls and holds below major support at 200, volatility will rise dramatically and we'll likely see some major profit-taking occur in the SPX.
  5. In the shorter term, you can also monitor activity in iShares iBoxx $ High Yield Corporate Bond (NYSE:HYG) and SPDR S&P Homebuilders (NYSE:XHB), as I recently described here and here, respectively, in connection with the SPX.

SPX-VIX
SPX Monthly Chart

Latest comments

Loading next article…
Risk Disclosure: Trading in financial instruments and/or cryptocurrencies involves high risks including the risk of losing some, or all, of your investment amount, and may not be suitable for all investors. Prices of cryptocurrencies are extremely volatile and may be affected by external factors such as financial, regulatory or political events. Trading on margin increases the financial risks.
Before deciding to trade in financial instrument or cryptocurrencies you should be fully informed of the risks and costs associated with trading the financial markets, carefully consider your investment objectives, level of experience, and risk appetite, and seek professional advice where needed.
Fusion Media would like to remind you that the data contained in this website is not necessarily real-time nor accurate. The data and prices on the website are not necessarily provided by any market or exchange, but may be provided by market makers, and so prices may not be accurate and may differ from the actual price at any given market, meaning prices are indicative and not appropriate for trading purposes. Fusion Media and any provider of the data contained in this website will not accept liability for any loss or damage as a result of your trading, or your reliance on the information contained within this website.
It is prohibited to use, store, reproduce, display, modify, transmit or distribute the data contained in this website without the explicit prior written permission of Fusion Media and/or the data provider. All intellectual property rights are reserved by the providers and/or the exchange providing the data contained in this website.
Fusion Media may be compensated by the advertisers that appear on the website, based on your interaction with the advertisements or advertisers.
© 2007-2025 - Fusion Media Limited. All Rights Reserved.