⭐ Start off 2025 with a powerful boost to your portfolio: January’s freshest AI-picked stocksUnlock stocks

SPX Outperforming Gold And Oil

Published 01/13/2020, 02:50 PM
Updated 07/09/2023, 06:31 AM
XAU/USD
-
US500
-
GC
-
CL
-
GVZ
-
VIX
-
OVX
-

Further to my post of January 5, the following provides an update on price action as of Thursday's close.

The following monthly chart shows the SPX, GOLD and OIL in comparison format, as well as their respective high, low and today's closing price for January, so far.

The instrument currently facing the "path of least resistance" is the SPX. It shot through prior near-term resistance (now support) of 3233 and continues to rally.

While GOLD and OIL tested (and briefly overshot) their near-term resistance levels of 1600 and 65.00, respectively, they've retreated substantially. Not only do these remain near-term resistance levels, there is considerable overhead supply above those levels, presenting the "path of greatest resistance."
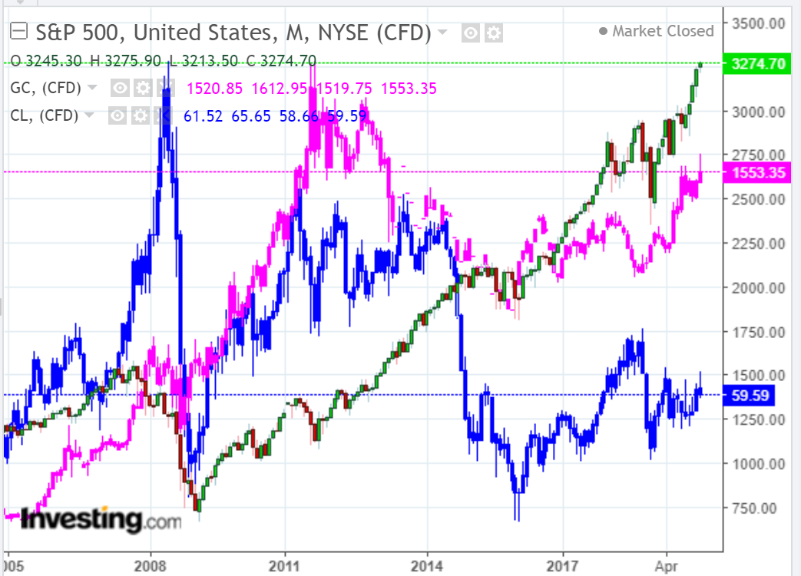
S&P 500

The following SPX:VIX daily ratio chart shows price nearing its prior historical highs around 280 or just above.

To confirm an SPX continued rally, watch for:
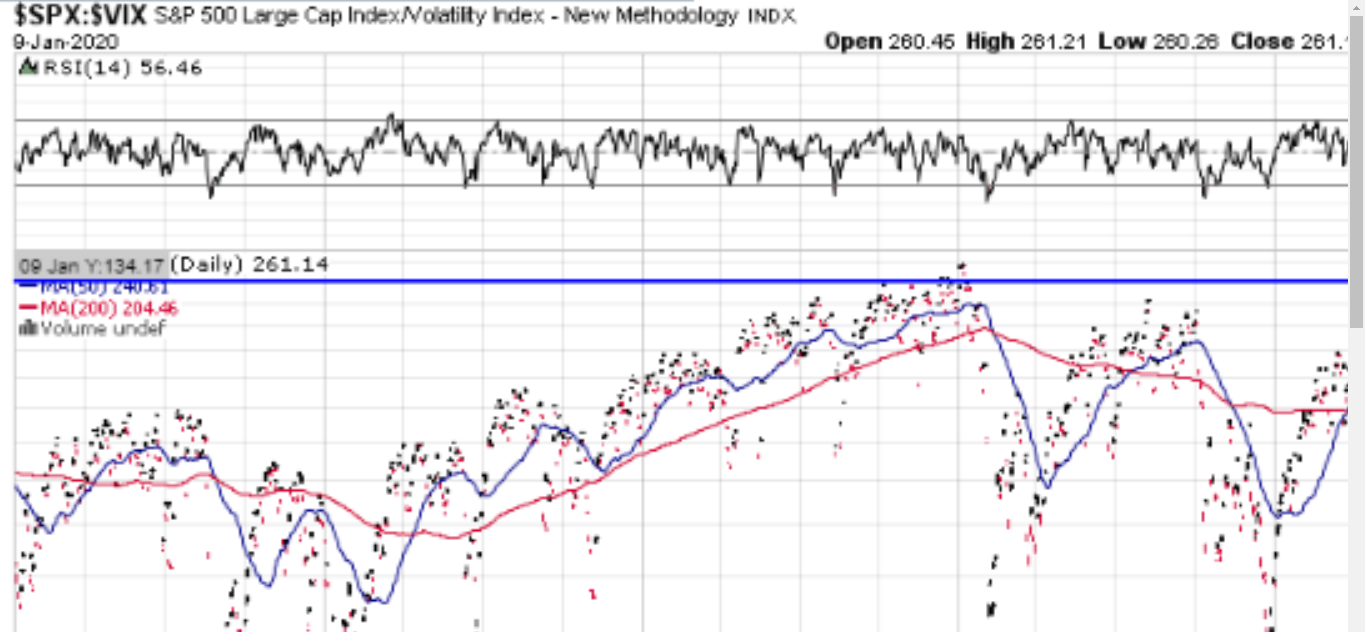
  • the RSI to break and hold above its downtrend formation and hold above 50.00
  • the recent bullish MACD crossover to hold
  • the PMO to form a bullish crossover and hold
  • as I mentioned in my above-referenced post, the next major resistance level (target) for the SPX is 3350
  • SPX:VIX Ratio

    The following GOLD:GVZ daily ratio chart shows that price is caught between its 50 and 200 moving averages.

    To confirm whether the recent GOLD pullback reverses and retests 1600, or higher, watch for:

  • the RSI to break and hold above 50.00
  • the MACD to form a bullish crossover and hold
  • the PMO to form a bullish crossover and hold
  • price to blow through and hold above the 50 MA at 127.67
  • Otherwise, watch for GOLD weakness to continue, especially if the ratio price breaks and holds below its 200 MA at 114.27.
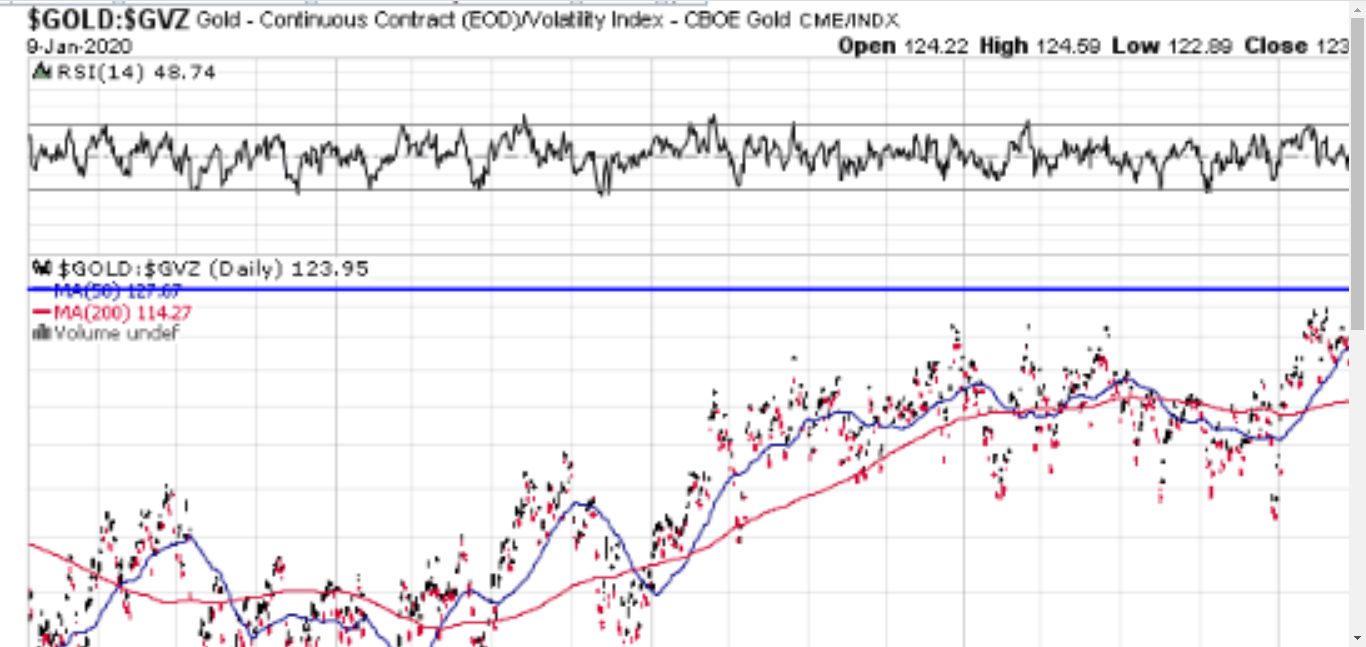
    GOLD:GVZ Ratio

    The following WTIC:OVX daily ratio chart shows that price is caught between its 50 and 200 moving averages.

    To confirm whether the recent OIL pullback reverses and retests 65.00, or higher, watch for:

  • the RSI to reverse, break and hold above 50.00
  • the MACD to form a bullish crossover and hold
  • the PMO to form a bullish crossover and hold
  • price to blow through and hold above the 50 MA at 1.93
  • Otherwise, watch for OIL weakness to continue, especially if the ratio price breaks and holds below its 200 MA at 1.78.
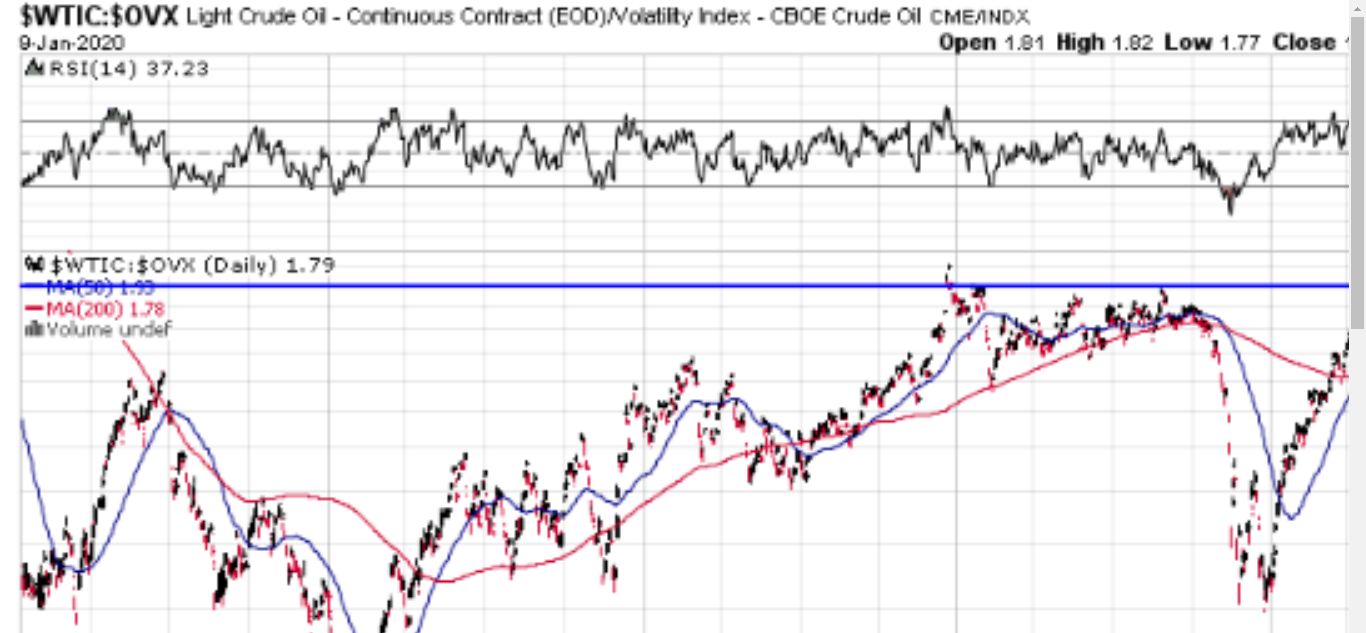
    WTIC:OVX Ratio

    Latest comments

    Loading next article…
    Risk Disclosure: Trading in financial instruments and/or cryptocurrencies involves high risks including the risk of losing some, or all, of your investment amount, and may not be suitable for all investors. Prices of cryptocurrencies are extremely volatile and may be affected by external factors such as financial, regulatory or political events. Trading on margin increases the financial risks.
    Before deciding to trade in financial instrument or cryptocurrencies you should be fully informed of the risks and costs associated with trading the financial markets, carefully consider your investment objectives, level of experience, and risk appetite, and seek professional advice where needed.
    Fusion Media would like to remind you that the data contained in this website is not necessarily real-time nor accurate. The data and prices on the website are not necessarily provided by any market or exchange, but may be provided by market makers, and so prices may not be accurate and may differ from the actual price at any given market, meaning prices are indicative and not appropriate for trading purposes. Fusion Media and any provider of the data contained in this website will not accept liability for any loss or damage as a result of your trading, or your reliance on the information contained within this website.
    It is prohibited to use, store, reproduce, display, modify, transmit or distribute the data contained in this website without the explicit prior written permission of Fusion Media and/or the data provider. All intellectual property rights are reserved by the providers and/or the exchange providing the data contained in this website.
    Fusion Media may be compensated by the advertisers that appear on the website, based on your interaction with the advertisements or advertisers.
    © 2007-2025 - Fusion Media Limited. All Rights Reserved.