With the markets making wild swings over the past month not seen since August 2017 arguably November 2016, dropping 10+% in early February, only to reclaim most of it two weeks later, emotions -as usual- run high, and thus many pundits claim one thing (bounce, and continued crash) or the other (low is in, new ATHs coming soon). But who is right? One thing is for certain: money and emotions don’t go well together.
With all the confusion and emotions, I decided to share my view of the market and it may surprise you. I take that back, if you’d follow my daily market update archive you would already know them: see here. These four intermediate-term possible Elliot Wave-counts were revisited in one of this week’s premium members daily market update from, which will be posted in the archive later this week, early next week.
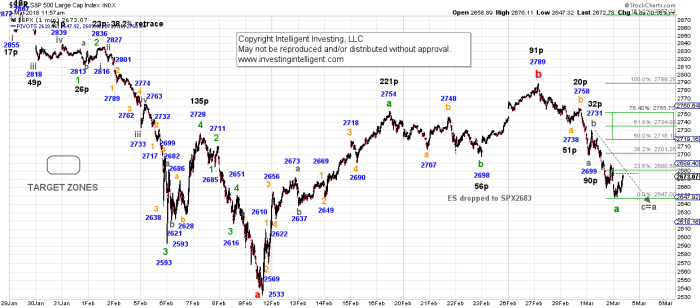
Let’s take a look at the short term first. In essence there are two main possibilities: 5 waves up off the S&P 5002533 low to the S&P 5002789 low, or only 3-waves up. One can make a case for both. The former has (red) intermediate wave ii of possible as complete as it reached the ideal target zone with an almost ideal c=a extension. A break over S&P 5002789 will confirm.
The alternate count has only 3-waves up, which can be counted as a b-wave top, or as an a-wave top. “An a-wave?” I hear you say. “Yes!” because that fits with several off the bigger picture scenarios I will show today. Cont’d below.
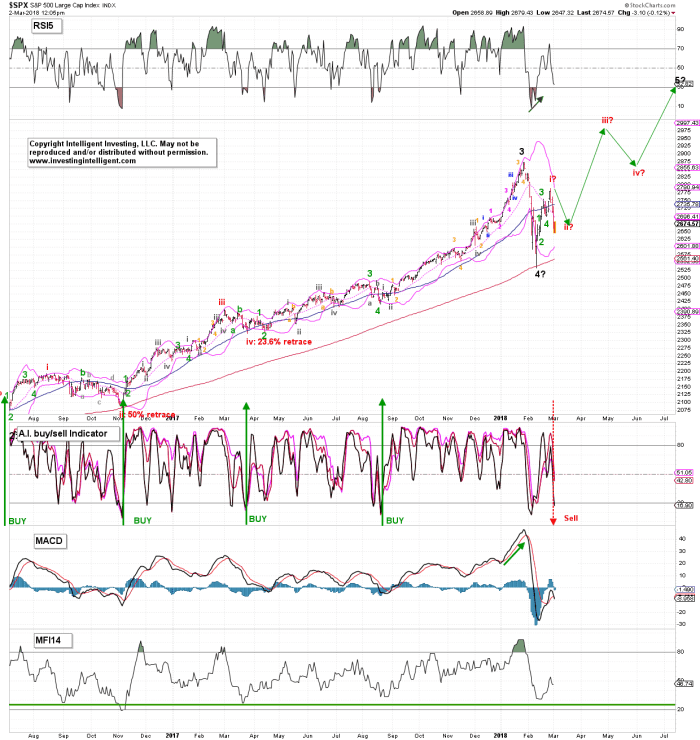
Let’s start with the two Bullish possibilities. The preferred view remains a simple, straightforward, impulse up to S&P 5003000+/-100. The green lines, already drawn in the chart last week, see here, show the anticipated path forward and although I slightly adjusted the lines lower given the more recent price action, so far the market is not doing anything exceptional and “my green path” is thus actually following along nicely. So far so good.
The alternative, shown below is that of the ending diagonal triangle (EDT), which is very common for a 5th wave, and here the shorter-term alternative “3-waves up for an a-wave” EWT-count shown earlier comes into play as EDTs consist of a 3-3-3-3-3 wave. Again, I’ve not changed the projected “green-path” since last week, and also here: so far so good. In addition, I’ve not seen any body else consider this possibility…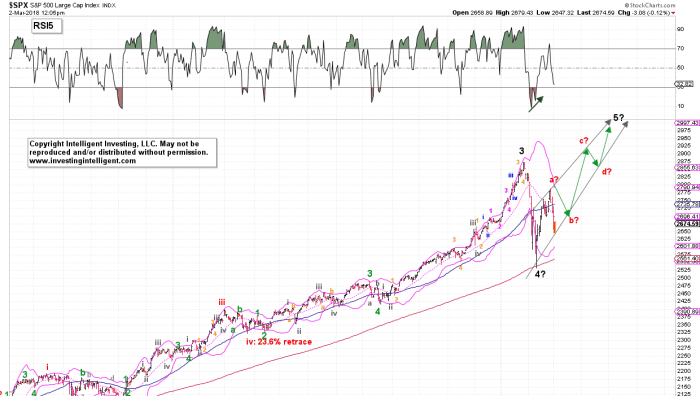
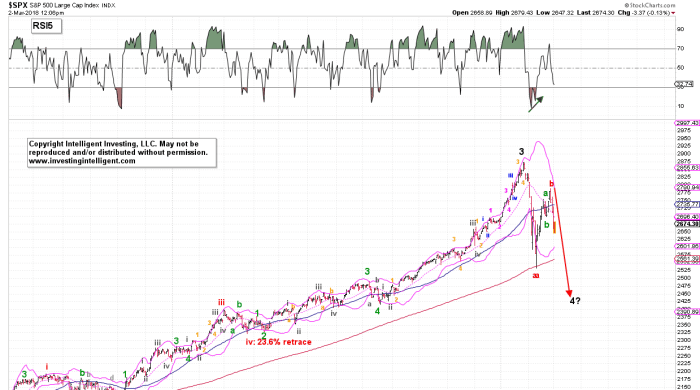
The two intermediate-term Bearish possibilities are shown below, and also here the “3-waves up” EWT count is the underlying basis for both. The first is the “dreaded” triangle, which will whipsaw many market participants. I’ve adjusted the triangle due to the top at S&P 5002789 from what I showed last week: anticipate, monitor, adjust. Also here I’ve not seen anybody else (publicly) consider this possibility whereas 4th waves are notorious for forming triangles. It be fair and wise to even remotely consider it until proven wrong…
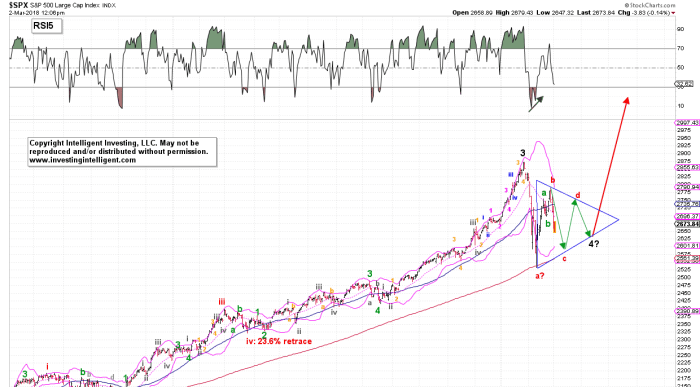
The 2nd bearish alternative, and which is they one you see presented by most pundits, is the zig-zag with wave-a and wave-b completed, and wave-c now underway. Since c-waves are fast and furious, this thing needs to start to accelerate to the downside real soon. So far so good you’d say considering the last few days.
However, since the NAS’ and NDX’ recent “bounce” retraced almost 100% of the prior decline, a zig-zag is not possible for these indices. If there is a c-wave down, it will be a flat correction for them. It is a bit odd to have a zig-zag for the S&P (and DJIA and NYA), while TECH has a flat correction. It’s not impossible, but given how well the S&P and NAS are correlated for example, this count is my least favorite. In addition, it seems as if anybody with even a rudimentary understanding of Elliot Wave Theory has this pattern front and center and posted it all over the web and on social-media these days. But, when most think the market will go a certain way, its likely too obvious, and the market will do something else…
For now, clearly there’s currently still too little price data to determine which of these 4 counts is operable. There’s even a 5th possibility, but I am not ready to share that one just yet.
Finally, this analysis shows the drawback of Elliot Wave in that there are always a myriad of wave-counts possible. It’s a great tool but like everything else, it should never be used as a stand-alone, can-do-it-all, trading tool. Anybody who claims the market will go only one certain way is thus not correctly seeing the possibilities and blinded by a certain, and set/fixed, biased opinion.

