The S&P 500 had a record-setting week closing at 3,066. Where it goes over, the short-term is challenging because we lose the benefit of having the past to help us predict the future, meaning we have lost the ability to have previous resistance line to target. So the best we can do is try to project. That may mean the increments and distances I can measure going forward on a short-term technical basis will be smaller, and less grandiose.
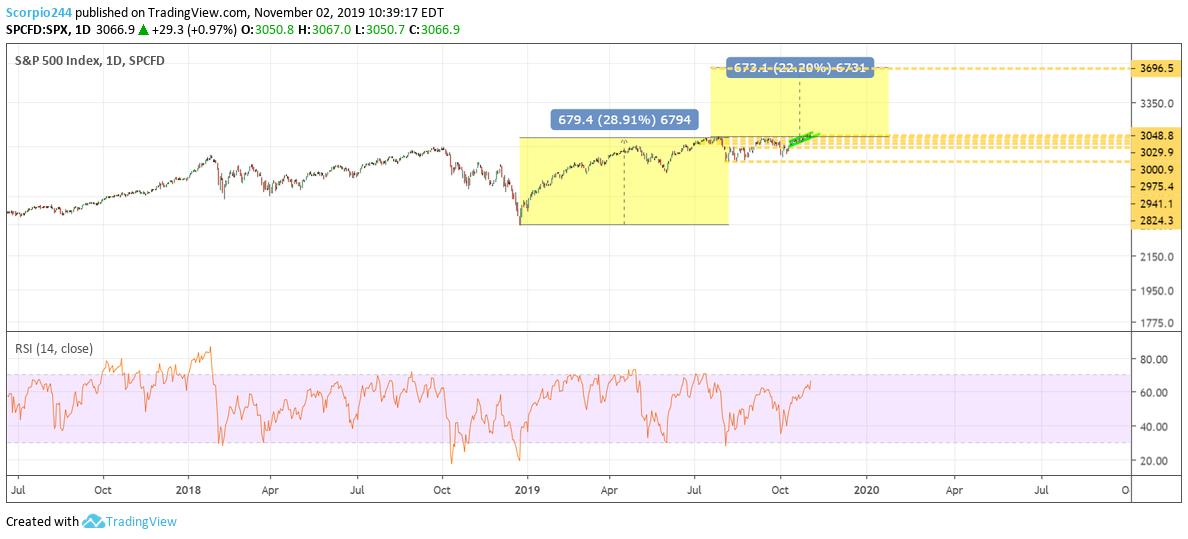
However, thinking on a longer-term basis using the move off the December lows, and assuming this recent move is genuinely the break out we have been anticipating and thinking it would be. The next move higher could be rather significant, to the tune of about 660 S&P 500 points, pushing the index ultimately to around 3,700. It sounds crazy, but consider that if the December lows to the peak in July was the first move higher, followed by the consolidation period until October, using the December to July move higher, and projecting that higher would take us to that 3,700 price target.
Of course, there is a chart that shows something similar when going back to 2011. We can see the S&P 500 has had two prior periods, where it consolidated for about 22 months, and on the 23rd month was the big break out, followed by a roughly 750 point move higher in both 2013 and 2016. If November 2019 represents the 23rd month of the consolidation period, then yesterday likely was the big break out we have been expecting.
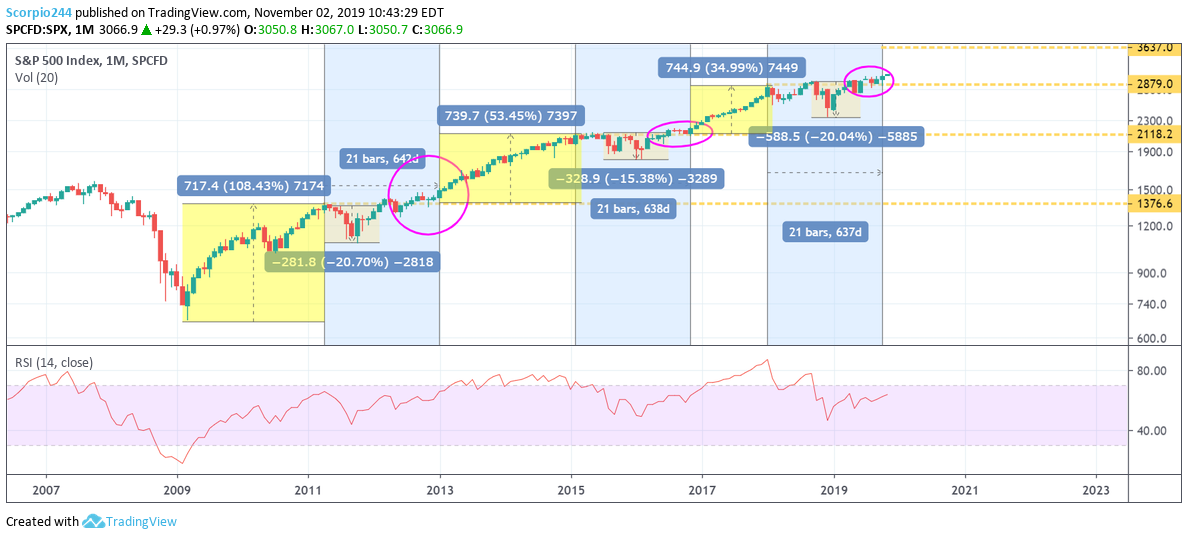
Additionally, a 750 point rise off of October 31 close of 3037, gets to 3,780, not that far off from our prior target.
Perhaps it is merely a coincidence, I do not know. I’m just calling it as I see it. Think about it how you’d like.
STOCKS
Apple)
The move higher in Apple Inc (NASDAQ:AAPL) has been breathtaking, and quite honestly, I can’t remember seeing this kind of moving higher in a stock with a market cap this big in recent memory. The stock appears to be in the middle of a big re-rating, where the market is assigning a new multiple to future earnings power. Perhaps the weakness in the iPhone in 2018 and 2019 was a blessing in disguise. It has allowed investors to realize that Apple is more than the iPhone and even more than services. It is the wearable business growth that is mind-boggling.
If the stock is genuinely amid a re-rating, then charts may be useless, and the stock may be heading to a 20 multiple on earnings estimates of $14.77, or $295.
Roku (ROKU)
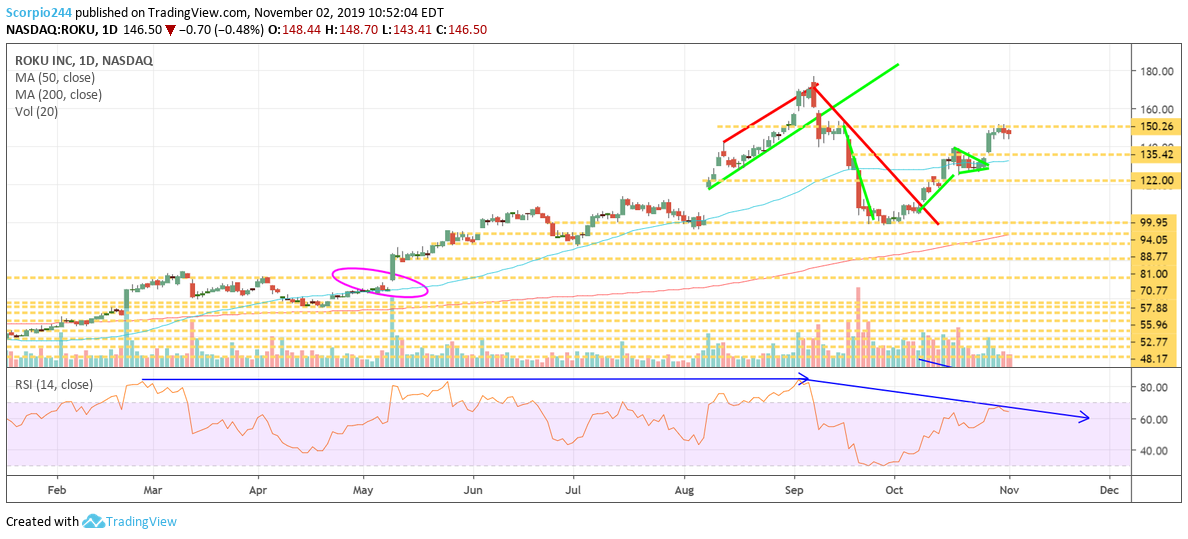
Roku Inc (NASDAQ:ROKU) will report results this week, and the stock is not acting particularly strong. $150 proved to be a healthy level of resistance on Friday despite a healthy day in the market. I still think this one is heading back to $135.
Nvidia (NVDA)
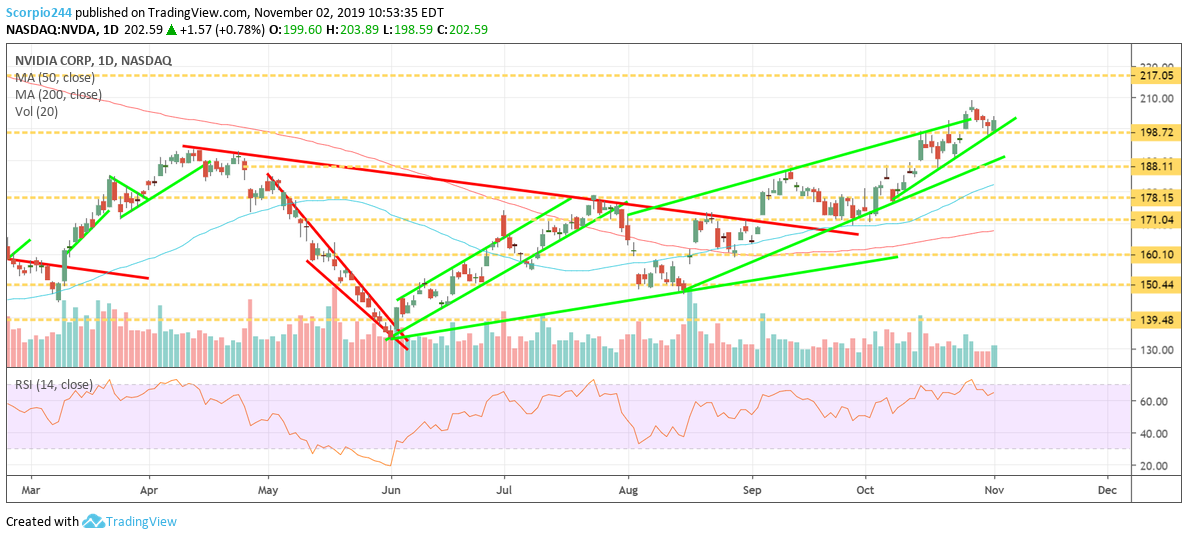
Nvidia appears to be acting very well and held support nicely this week around $198. Perhaps it can work it’s way higher still towards $217.
Micron (NASDAQ:MU)
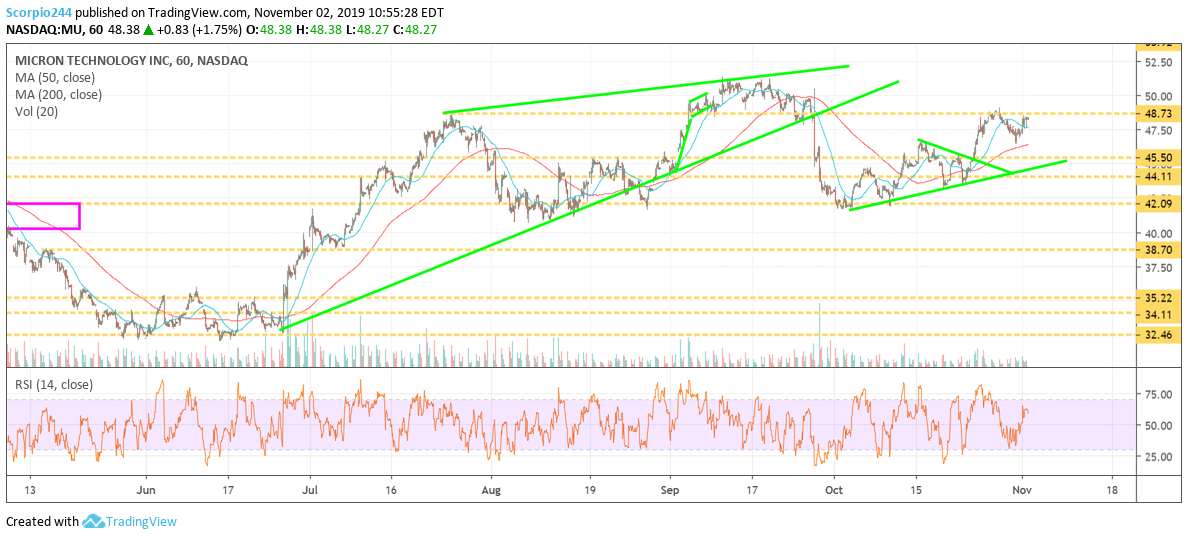
Micron Technology Inc (NASDAQ:MU) is very close to a big break out if it can clear $48.75, it can make that big higher back towards $51.
Tesla
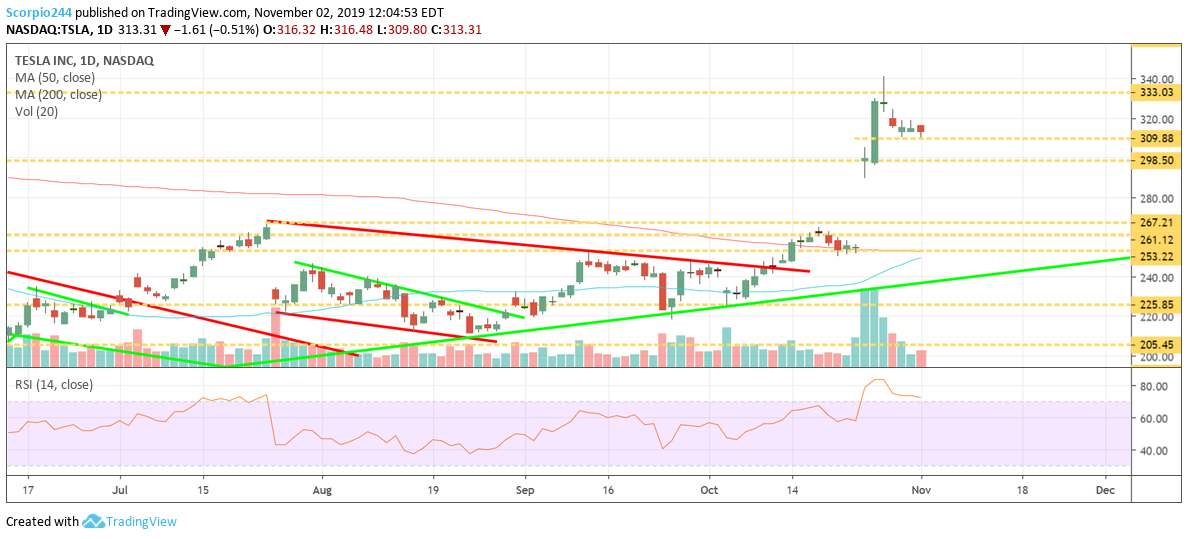
Tesla Inc (NASDAQ:TSLA) is holding support around $309, and if it can, then why can’t it head back to $333. If not, then $300. It is just that simple at this point.
JD (JD)
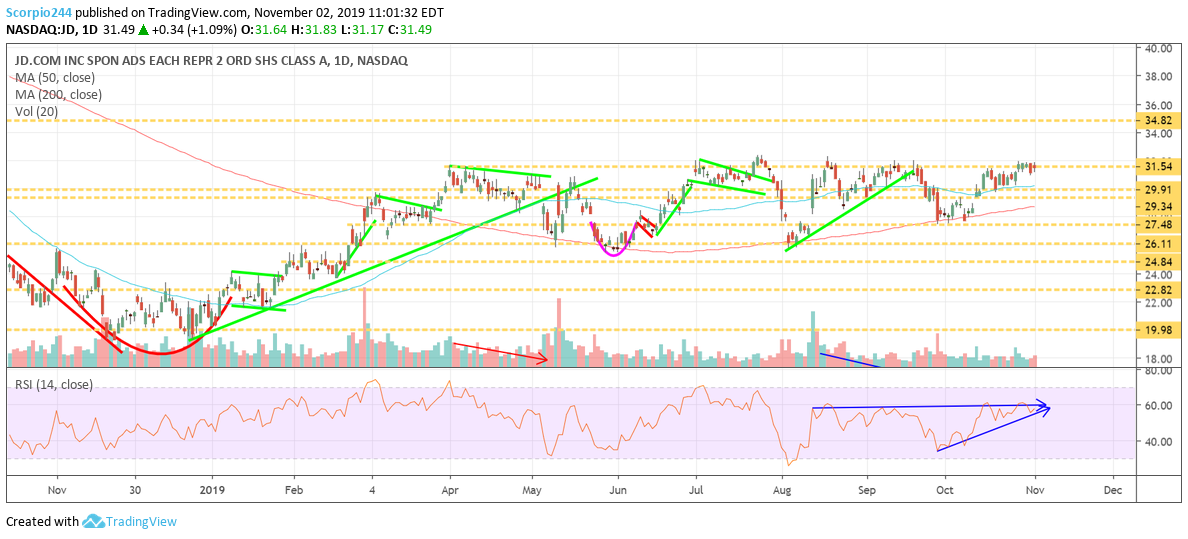
Will Jd.Com Inc Adr (NASDAQ:JD) ever rise above $31.50 again? It should, perhaps, this week it finally moves back to $34. The RSI suggests it does.
Back on Sunday with our Monster predictions for next week.
