
Already in June (see here), I alerted to a potential bullish wedge pattern forming on the S&P 500 (SPX), targeting 4300+—SPX4365-4530, to be exact.
Few believed me back then, but I’ve kept you abreast of the index’s progress, and this week it topped at $4325. Mission accomplished.
But what now? Is the bull run finished?
Two weeks ago (see here), I also shared the bearish Elliott Wave Principle (EWP) option I am tracking.
This week I would like to share a bullish one. Please see figure 1 below.
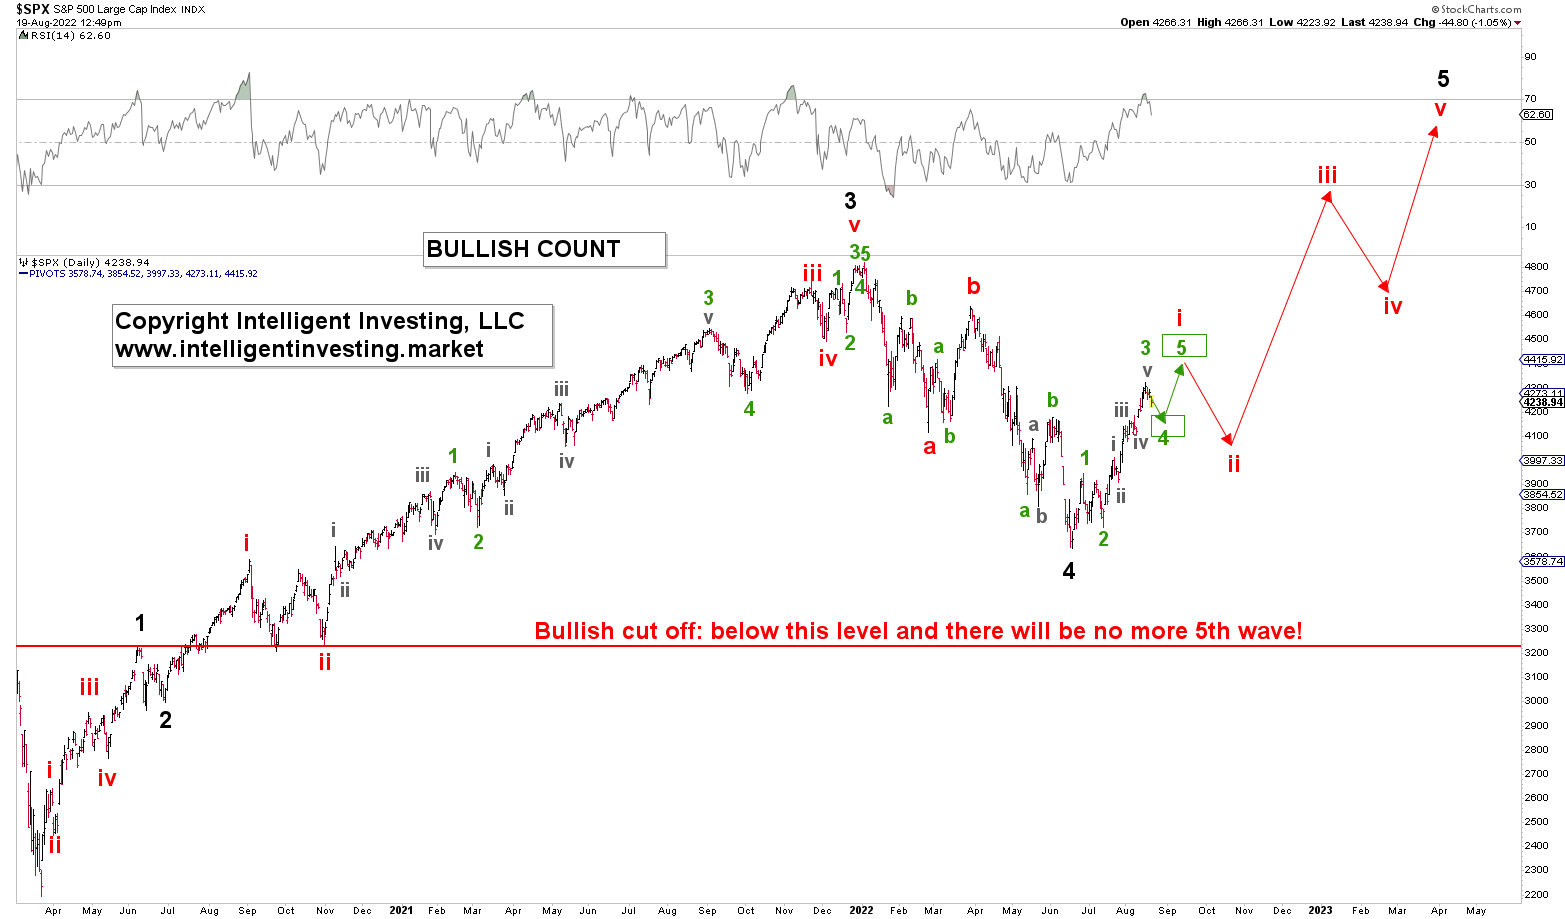
Figure 1. S&P500 daily chart with detailed EWP count and several technical indicators
The bullish EWP option shows the index completed a more significant 4th wave from March 2020 low and is now in the starting gates for a last more significant impulse, i.e., five-waves move to SPX5500+.
The SPX has, in this case, only completed (green) wave-3 of (red) wave-i of (black) wave-5 and is now working on the multi-day (green) wave-4. Note I already anticipated the current pullback in my update about the Nasdaq 100 a few days ago (See here).
Thus, for the bullish option, the S&P500 should ideally bottom between $4185-4095 (the green target zone; a typical 23.60-38.20% retrace of green wave-3) and then rally ideally to $4435-4525 for (green) wave-5 of (red) wave-i.
From the EWP, we know that in a bullish impulse, after the 1st wave come the 2nd, 3rd, 4th, and 5th waves. Thus, when wave-i completes, expect a more significant multi-week pullback for wave-ii. That should be a low-risk buying opportunity for wave-iii.