- Bulls have retaken control as stock indexes previous losses.
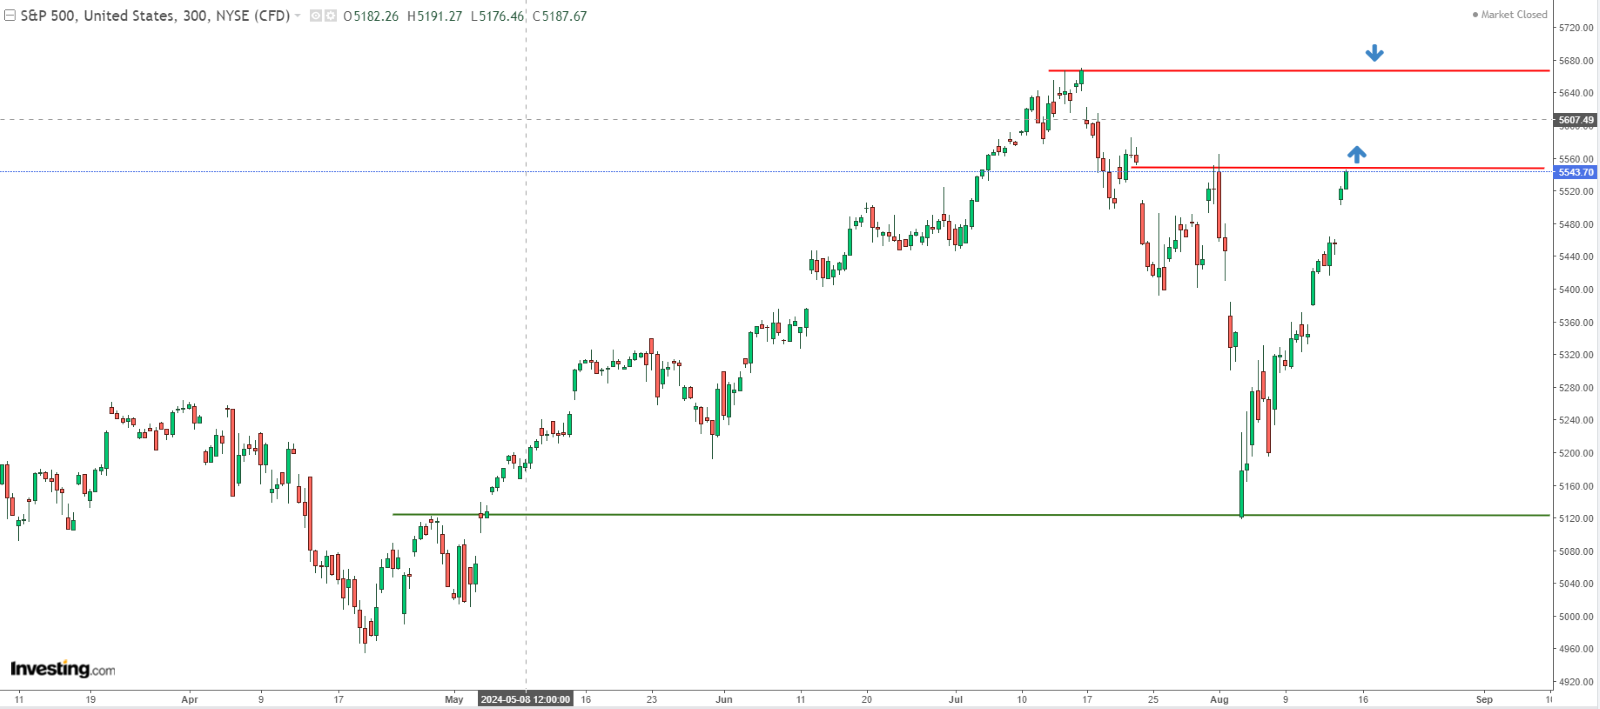
- The S&P 500 is testing a critical supply zone at 5550 points, with a breakout potentially targeting new highs.
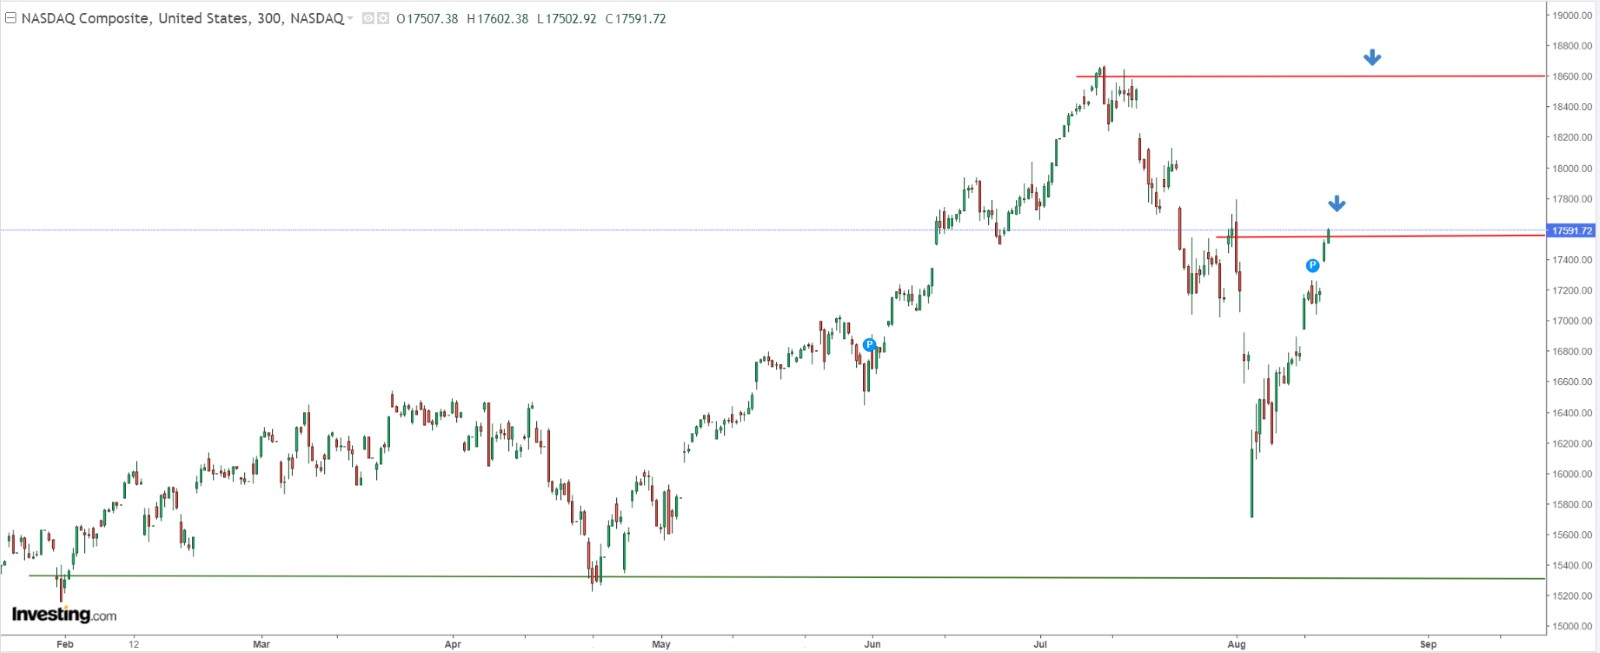
- Meanwhile, the Nasdaq eyes a key resistance at 17,600 points, where a breakout could signal a return to its long-term uptrend.
- For less than $8 a month, InvestingPro's Fair Value tool helps you find which stocks to hold and which to dump at the click of a button.
Last week's market downturn, sparked by concerns over a potential US recession, has abruptly reversed course. After positive economic data, investor sentiment has shifted, propelling stocks higher.
While Wednesday's US inflation data came in slightly better than expected, it's the overall improvement in market sentiment that's driving the current rally. The initial fear of a recession appears to be subsiding, allowing investors to focus on potential upside opportunities in the market.
Today's trading session is expected to kick off on a bullish note, but challenges remain if indexes are going to target all-time highs. With that in mind, we'll take a look at the technical situation in the S&P 500, Nasdaq and Dax.
S&P 500 - Bears in Retreat
The S&P 500 quickly erased its recent losses in just a few days, highlighting the strength of the bulls who are determined to continue the upward trend.
The immediate battle is now centered around the 5550-point level, a critical supply zone. If buyers manage to break through this level, they’ll be well-positioned to push higher, with the main target remaining the historical high of 5670 points.

In the medium to long term, the sustainability of these gains will hinge on upcoming key U.S. economic data.
The market's recent reaction to weaker-than-expected data suggests that if this trend continues, fears of a possible recession could resurface, leading to increased risk aversion among investors.
Nasdaq: Upcoming Resistances to Watch Out for
This week's dynamic gains have reversed the previous bearish outlook, signaling a potential return to the upward trend. A breakout from the currently tested supply zone around 17,600 points would confirm this bullish scenario.

Like the other indexes covered in today's analysis, a breakthrough in the nearest major resistance area could trigger an attempt to reach new highs. For the Nasdaq, that means targeting the historical peak near 18,600 points.
DAX Breaks Out of Medium-Term Consolidation
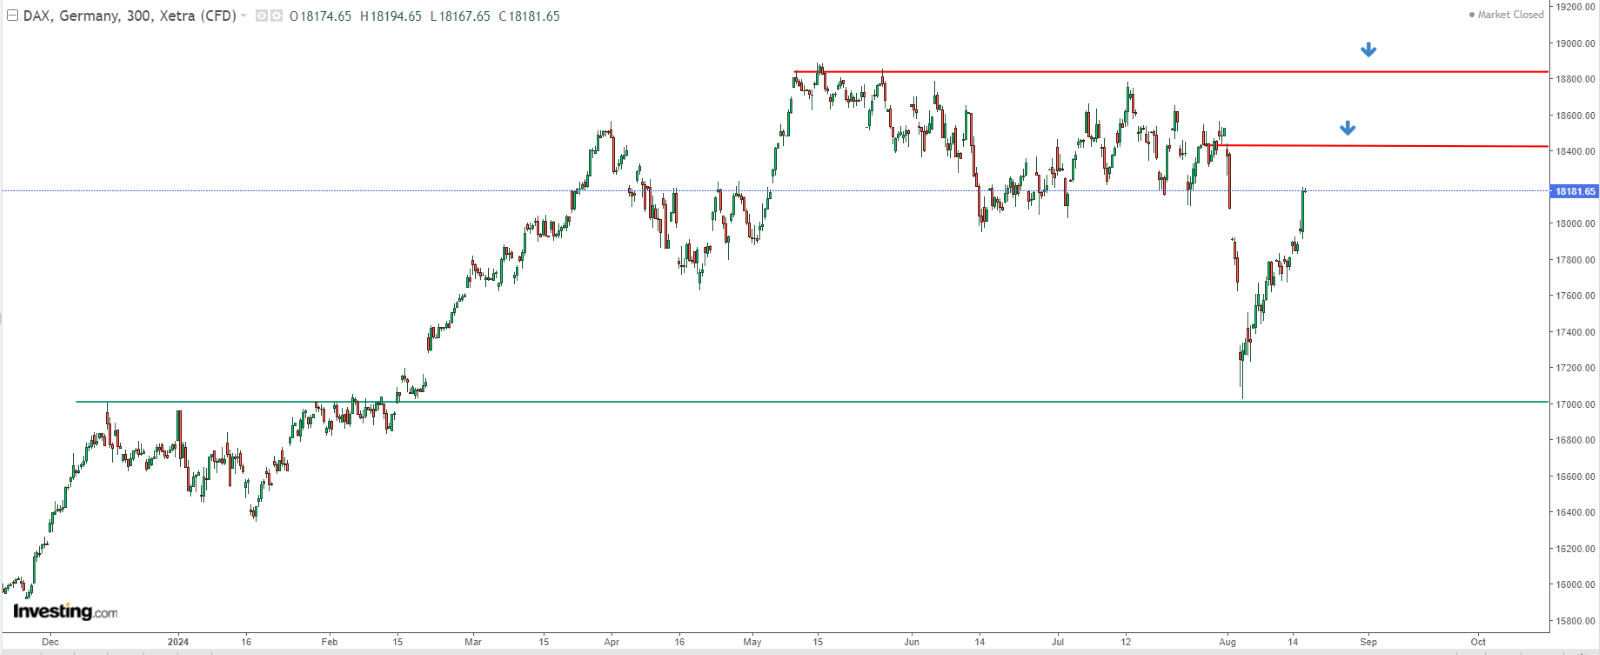
The German DAX has been in an uptrend.
Buyers are now targeting the supply zone around 18,400 points, with a potential breakthrough paving the way for continued upward momentum toward the historical highs just below 19,000 points.

The key support level lies at the 17,000-point mark, where a previous downtrend stalled.
***
This summer, get exclusive discounts on our subscriptions, including annual plans for less than $8 a month.
Try InvestingPro today and take your investing game to the next level.

Disclaimer: This article is written for informational purposes only. It is not intended to encourage the purchase of assets in any way, nor does it constitute a solicitation, offer, recommendation or suggestion to invest. I would like to remind you that all assets are evaluated from multiple perspectives and are highly risky, so any investment decision and the associated risk is at the investor's own risk. We also do not provide any investment advisory services. We will never contact you to offer investment or advisory services.
