Who is Kevin Hassett? Wolfe looks at the Trump ally tipped to become Fed Chair.

The S&P 500 futures rallied slightly on Globex, but popped up to 2581.25 after the US non-farm payroll number showed 261,000 new jobs in October. If you were watching CNBC before the jobs report was released, everyone was looking for a higher number, Rick Santelli from the floor of the CME Group (NASDAQ:CME) was the highest at 410,000.
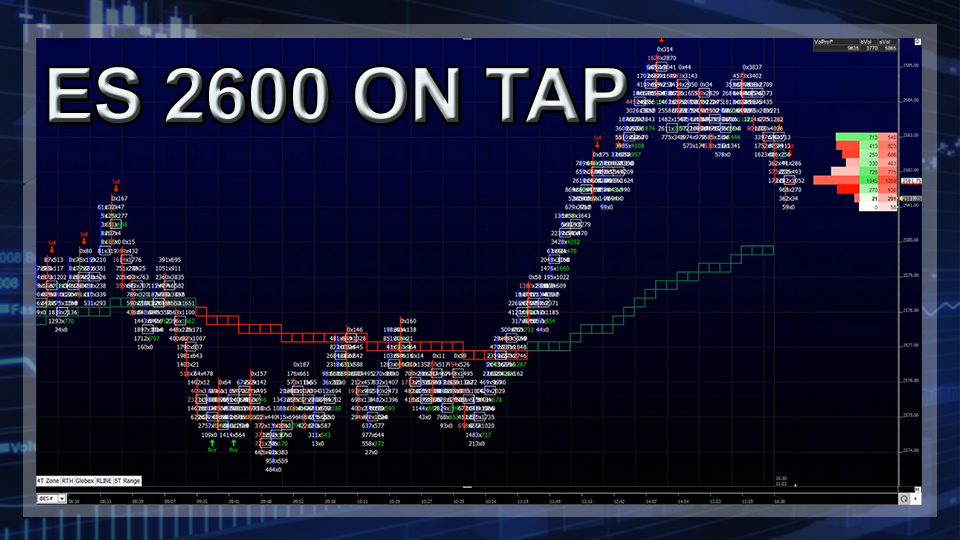
Fridays trade started with 146,000 ESZ17’s traded on Globex, with a range of 2581.25 to 2576.00. The first trade on the 8:30 CT futures open was 2579.00, and the first move was down to 2574.50, then down to the early low at 2573.50. At 9:40 CT, after the ES kept failing below the vwap, I put this out:
Dboy 10:40:34 es back and filling
I have to admit, I made several mistakes on Friday. I was long at 2575.00 and added 2526s, so my average was at 2575.50. I scratched that one, got back in, took a small loss, and then sat back and watched the ES run right up to 2579.00, a level I was looking to exit part of my position. And then I watched the ES rally above 2583.00. In Friday’s view I said that the buy stops started above 2583.00 to 2590.00, and at 1:30 the ES traded 2585.50. After a pullback down to 2583.00 the ES rallied back up to 2585.00. The MiM was showing $100 million to buy, but ‘flipped’, and the NYSE closing imbalance ended up at $10 million to sell, and the ES sold off down to 2582.50 On the 3:15 futures close.
For the most part, it was another day of ‘thin to win’ for the S&P 500 futures. Technology stocks were the main driver after Apple reported its best quarterly growth in two years. Apple shares (NASDAQ:AAPL) closed at $172.50, an all-time high, but about three dollars short of a major milestone; At $175.30, the company will become the first in history to ever be worth $900 billion. The Nasdaq closed at its 63rd record of the year, passing 1980 for the most closing highs in a calendar year. The Nasdaq futures (NQZ17:CME), up +0.85%, outpaced the S&P futures (ESZ17:CME), up +0.17%.
In the end the the S&P 500 futures (ESZ17:CME) settled at 2582.75, up +6.00 handles, or +0.23%; the Dow Jones futures (YMZ17:CBT) settled at 23449, up +5 points, or +0.02%; the Nasdaq 100 futures (NQZ17:CME) settled at 6290.50, up +54.75 points, or +0.87%; and the Russell 2000 (RTYZ17:CME) settled at 1494.80, down -1.30 points or -0.08% on the day.
As always, please use protective buy and sell stops when trading futures and options.
