September has been known as a very volatile month. It has included some very big moves, like the 1987 crash, but with the S&P up over 250% since its March 2009 credit crisis low, the S&P 500 had its least volatile September in 66 years. The change between the index’s closing high and closing low for the month is just 2.1%, the smallest since 1951. The question on many investors minds is simple… How long can the VIX stay so low, and stocks keep going up, before any major pullback?
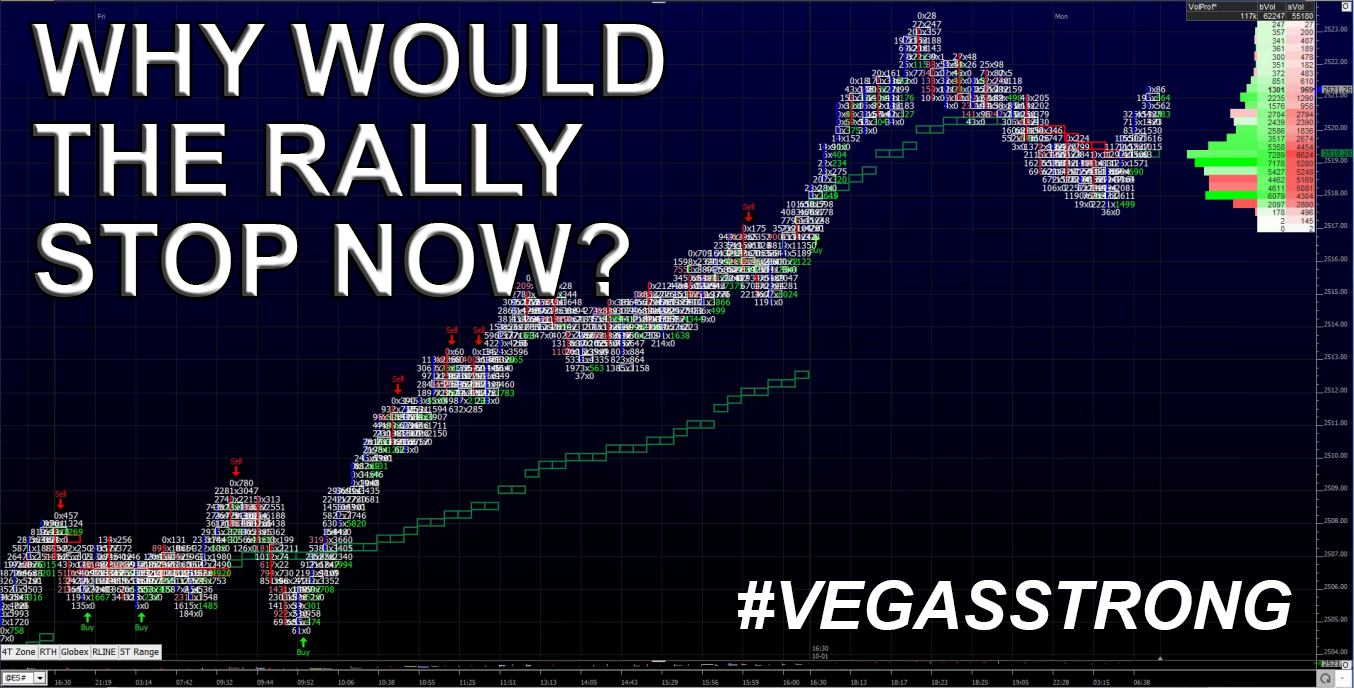
On Friday morning the S&P 500 futures (ESZ17:CME) opened at 2506.50. Total globex volume was low, only 133,000 contracts traded. The overnight trading range was 2505.25 to 2507.75, a mere 2.5 handles. After the 8:30 futures open, the ES traded up to another new contract high at 2509.25, and then dropped down to 2504.75. The next move was straight up to another new all time high at 2511.75 at around 9:45 CT. The next pop pushed the ES up to 2515.50 at 11:43 CT.
After the early low, there were almost no pullbacks, it’s like the ES and NQ are on auto-pilot. Uptick, uptick, uptick, drop a few ticks, and then start right back up again. After a pull back down to 2512.50 the ES traded back up to 2515.25, and started to pull back as the MrTopStep MiM ( https://mrtopstep.com/l/mim/ ) started to show over $320 million to buy, and then increased up to $787 million to buy. At 2:45, the cash imbalance on the NYSE MOC showing $1.2 billion to buy, and the ES traded up to a new high at 2517.00 on the 3:00 cash close.
Why Do The Markets Keep Going Up?
Despite the continued concerns about North Korea, U.S. policy and the Federal Reserve tightening, and runaway valuations, the S&P made its 39th high of the year on Friday. While some will say it’s due to the big investment firms and pension funds pouring cash into the credit markets at a record pace, I think that’s only part of the reason. The main reason is ‘ultra’ low interest rates, and a ‘no place to go but into stocks’ mentality.
Since the March 2009 credit crisis low of 666, the S&P 500 is up over 270%, or 16.8% annualized, outpacing every other major market over that period. Starting in 2013, and through 2015, the S&P 500 Index gained 52% cumulatively, whereas core bonds returned 4%. While everyone continues to call for a top, I don’t think there is going to be any major stock market sell off / crash, and the current rally could last for another 2 to 3 years, barring a nuclear war with North Korea. Even if the fed does get more aggressive with pushing rates higher, it will take atleast 3 to 5 years to push them up high enough to really slow down the pace.
Is S&P 2500 or 2600 possible? I think the answer is more of a question of who would have thought the S&P would be trading 2520 10 years ago?
According to Pimco “there were two periods in particular that stand out. The dot.com–fueled bull market of the late 1990s through early 2000 drove significant outperformance of U.S. 60/40 over diversifiers; this was followed by more than a decade of outperformance by diversifying assets, which made up the shortfall with room to spare. And in 2013–2015, U.S. stocks again drove meaningful outperformance of U.S. 60/40 versus diversifiers before the diversifiers began to rebound in 2016, and we think diversifying assets may still be in the early stages of a sustained outperformance cycle.”
Looking at current U.S. equity valuation metrics reinforces this view. The S&P 500 is facing a triple threat: Dividend yields are near historical lows, earnings levels are near historical highs and cyclically adjusted price-to-earnings ratios also appear high by historical standards.
In contrast, many diversifying markets, which have lagged in the recent past, now offer relatively attractive starting prices, yields, and (in our view) forward-looking return potential.
Investment implications
Given fully valued U.S. stock markets, what should investors do? One potential solution is to consider strategies designed to harness the complementary return potential of diversifying assets. In our view, the diversifiers are up next. (Pimco)
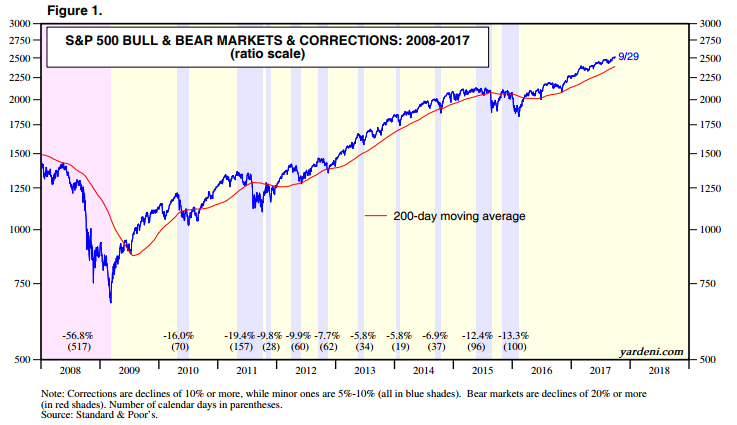
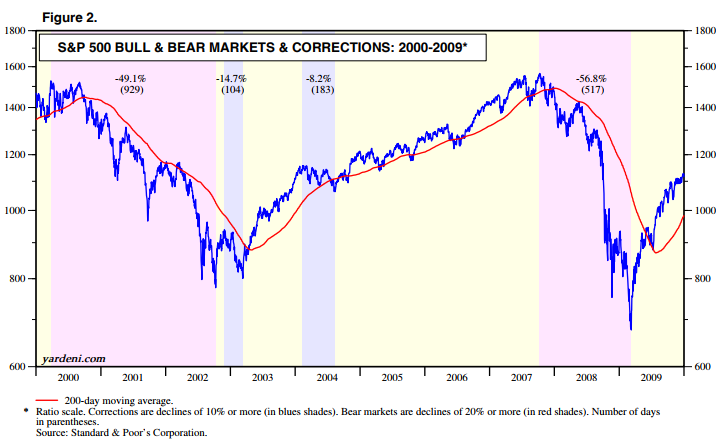
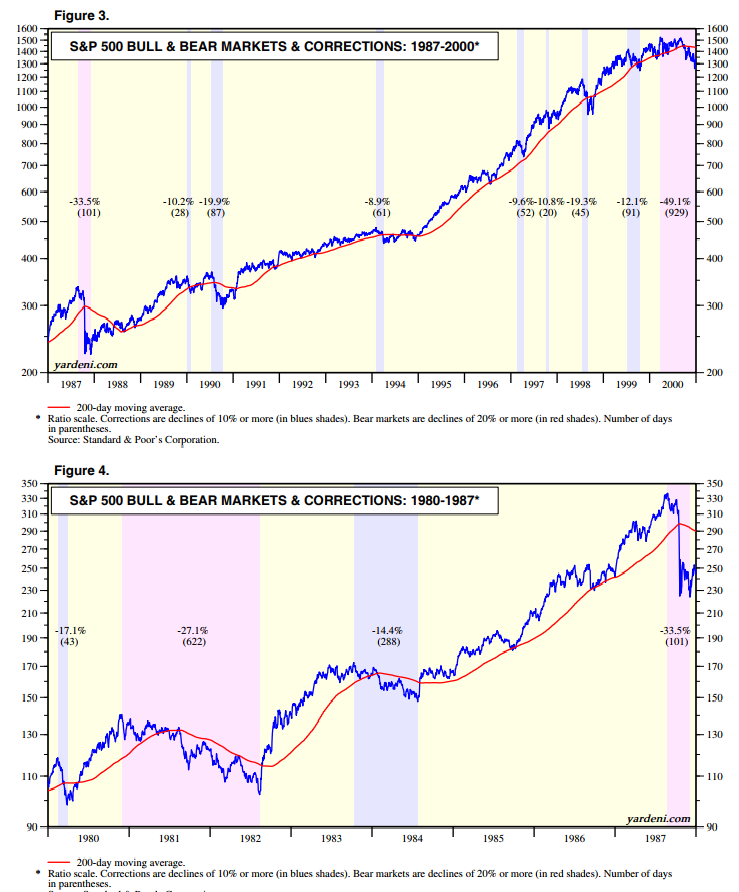
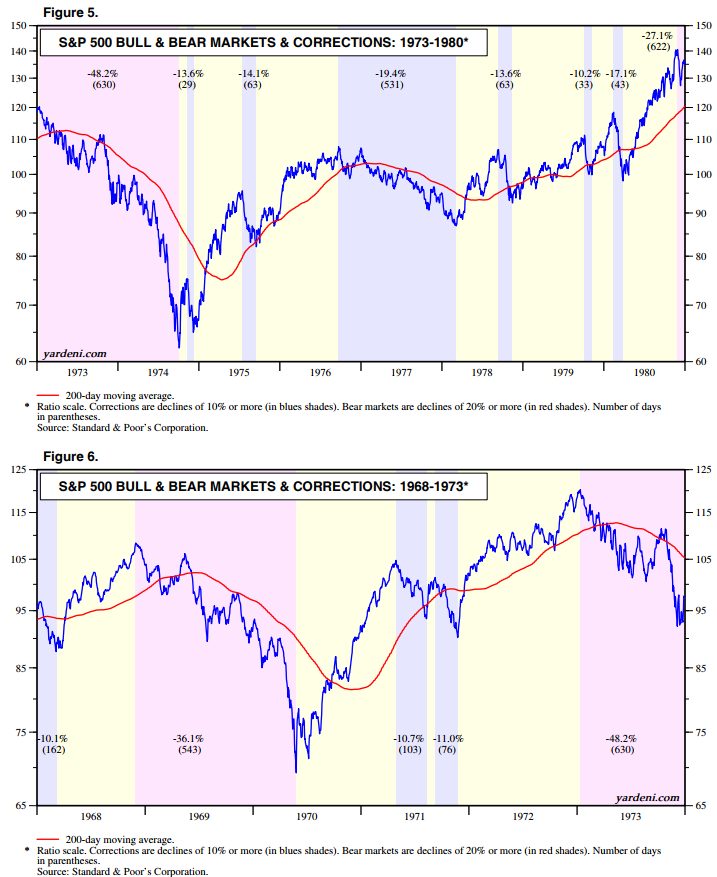
Bull & Bear Markets & Corrections
I do not disagree but what I believe is if your portfolio is up as much as the S&P is over since 2009 you should consider a strategy of ‘lockin
g in some profits’ What I do disagree with is that the end is near. Is it possible the S&P sells off? Sure but I do not think any 20% corrections are coming anytime soon. Below are some charts of: Bull & Bear Markets & Corrections.
While You Were Sleeping
Overnight, equity markets in Asia and Europe traded higher across the board, as investors overseas are keeping an eye on the rise of the Catalan separatists.
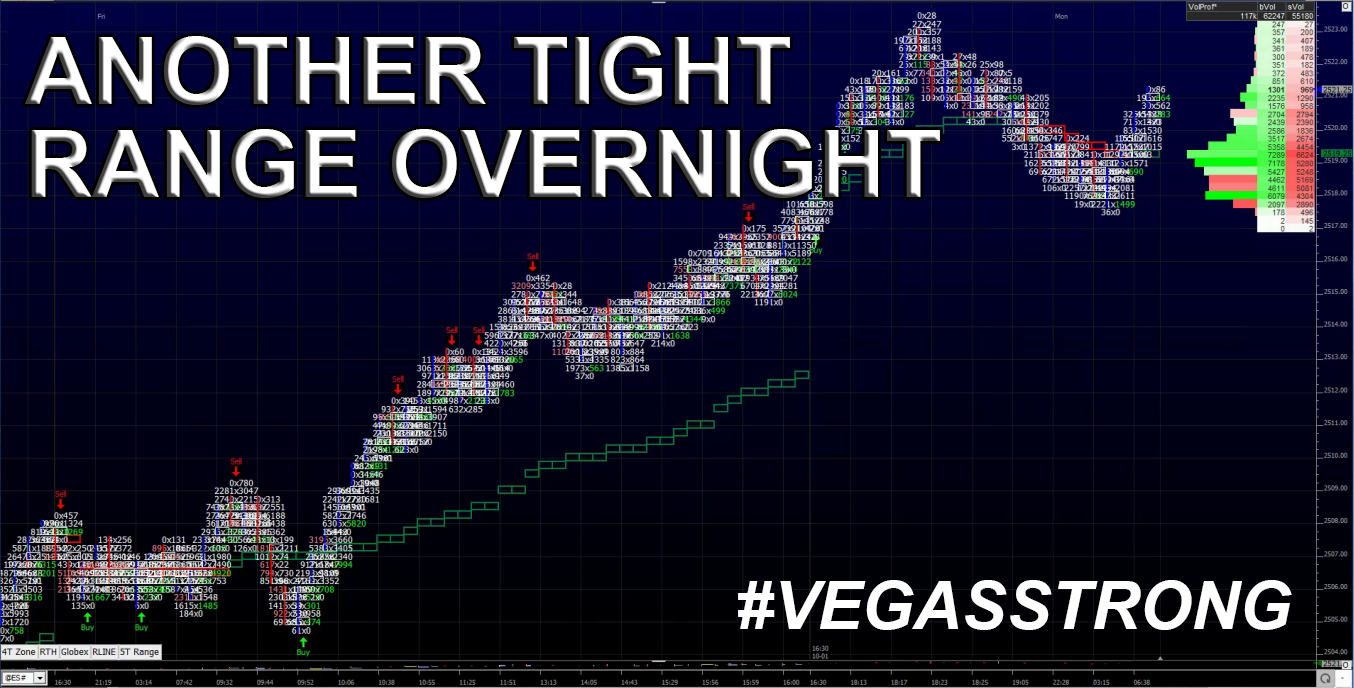
In the U.S., the S&P 500 futures opened last night’s globex session at 2518.00, and were held to just a 6.5 handle range. Overnight participation the E-Mini S&P 500 futures has become increasing less popular, and it shows when you look at recent globex pre-8:30 CT volume and trading ranges. As of 7:15 am CT, the last print in the ES is 2520.50, up +4.50 handles, with 121k contracts traded.
In Asia, 9 out of 11 markets closed higher (Shanghai +0.29%), and in Europe 11 out of 12 markets are trading higher this morning (FTSE +0.52%).
Today’s economic includes PMI Manufacturing Index (9:45 a.m. ET), ISM Manufacturing Index (10:00 a.m. ET), Construction Spending (10:00 a.m. ET); Fedspeak — Robert Kaplan Speaks (2:00 p.m. ET).
Warren Buffett: ‘You have to be greedy and others are fearful and fearful when others are greedy’
Our View: According to the Stock Trader’s Almanac, the first trading day of October has the Dow down 7 out of the last 11 occasions, down -2.4% in 2011. Also, October ends the worst 6 months for the Dow and S&P, and the worst 4 months for the Nasdaq. And, let’s not forget the Dow was down 1874 points or -18.2% on the week ending 10/10/08, the worst week for the Dow in the history of Wall Street. Let it be said, October can be a tricky month. That said, a lot of people are talking about 2525 as being a possible top in the ES. Our view is to sell any gap up open, or the first rally, wait for a pull back, and look for a good spot to be a buyer.
