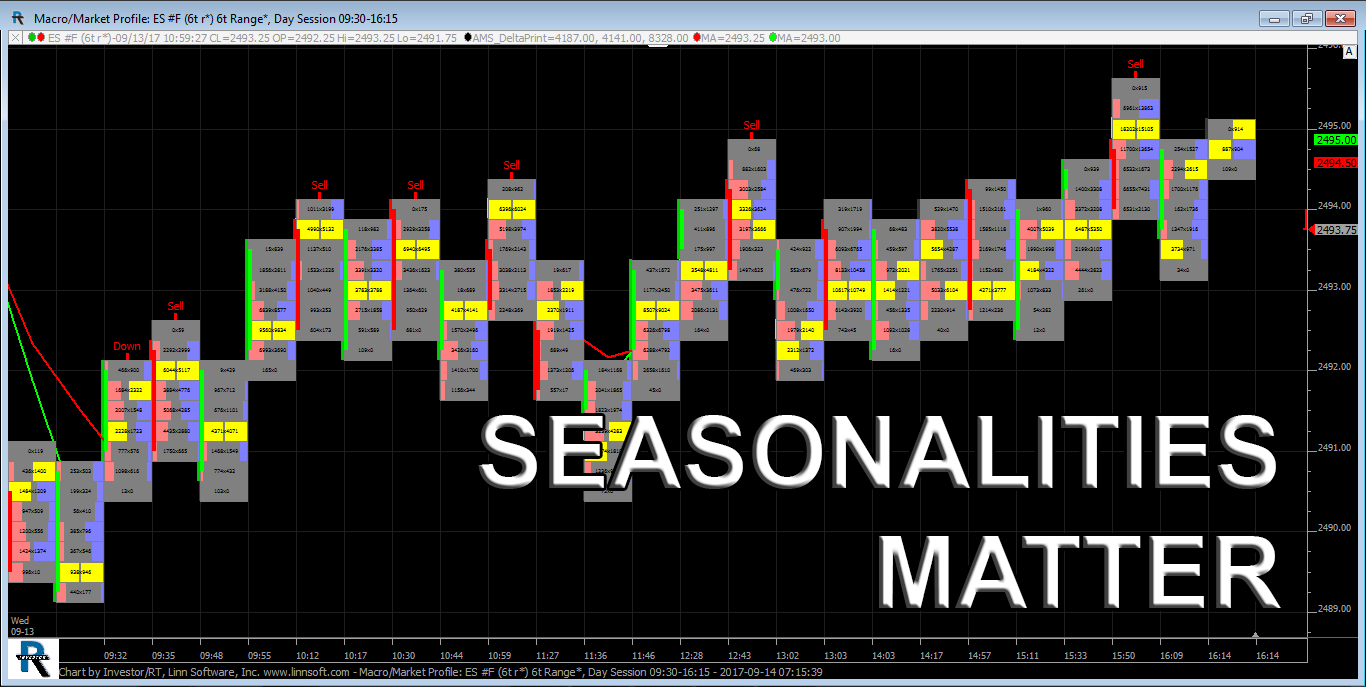
After showing weakness in the overnight trade, the S&P 500 futures (ESZ17:CME) opened the cash regular session at 8:30 am cst yesterday printing 2490.50, down 3.75 handles, and then made the low of day at 2489.25 within the opening minutes, before buy programs pushed the index up to a 2494.24 high just after 10:00 am cst.
After a pullback down to 2490.50, just after the Euro close, the ES once again started it’s uphill climb back to new all time highs, reaching 2494.75 just after 11:30 ct. From there, the ES pulled back down to 2492.00, and then into the close rallied once more printing a new all time high at 2495.50, before settling the day at 2495.00, up three ticks, but another day where bulls were in charge buying dips and keeping this market in rally mode. The market-on-close imbalance came in at $690 million on the buy side.
There is not a lot to elaborate or commentate on with yesterday’s trade, and the current markets except more of the same. After Sunday night’s gap up, when North Korea fears had subsided, and the markets have only passive response to Hurricane’s Harvey and Irma, it seemed like the coast was clear for S&P 500 futures 2500, and it still seems like there is nothing to deter that.
Below is another contribution from the Stock Trader’s Almanac. Listen, we all need to pay attention to the historical patterns, as I have been saying for years. However, the recent pattern is important as well. When the S&P doesn’t act weak when it’s supposed to, it probably means new all time highs on the way.
If not September, perhaps October then
From the Stock Trader’s Almanac:
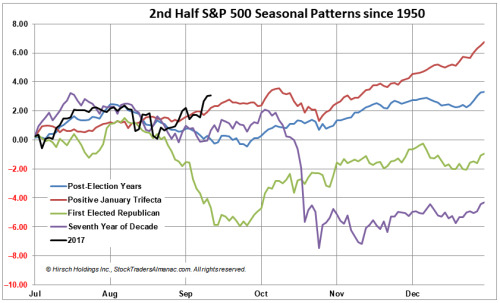
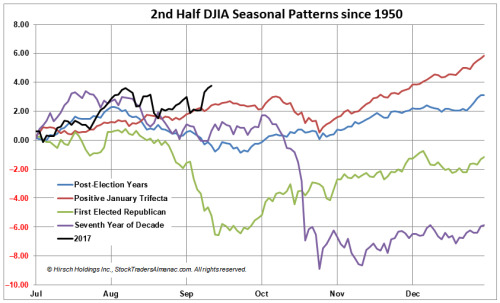
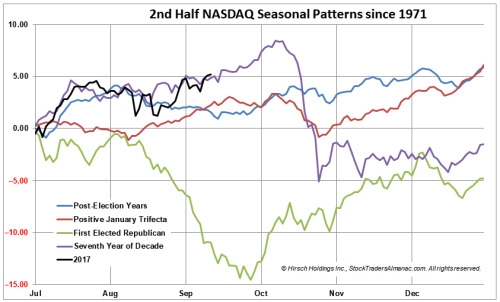
Last month we presented updated 1-Year Seasonal Pattern charts for DJIA, S&P 500 and NASDAQ with historical patterns beginning at the start of the second half of 2017. At that time, volatility was on the rise and the market was slipping modestly lower and since then the market recovered and DJIA, S&P 500 and NASDAQ all closed at new all-time highs again today. At today’s close DJIA, S&P 500 and NASDAQ are all performing modestly better than their respective best case scenario seasonal patterns for this point in the second half of the year. The prospects for a tepid second half of September still remain and even if September does buck historical patterns this year with solid gains, October could still present an issue as two of four (the most optimistic) seasonal patterns tracked in the charts above and below, turn negative.
While You Were Sleeping
Overnight, equity markets in Asia and Europe traded mixed, with a slight bias to the downside, on new fears coming out of North Korea.
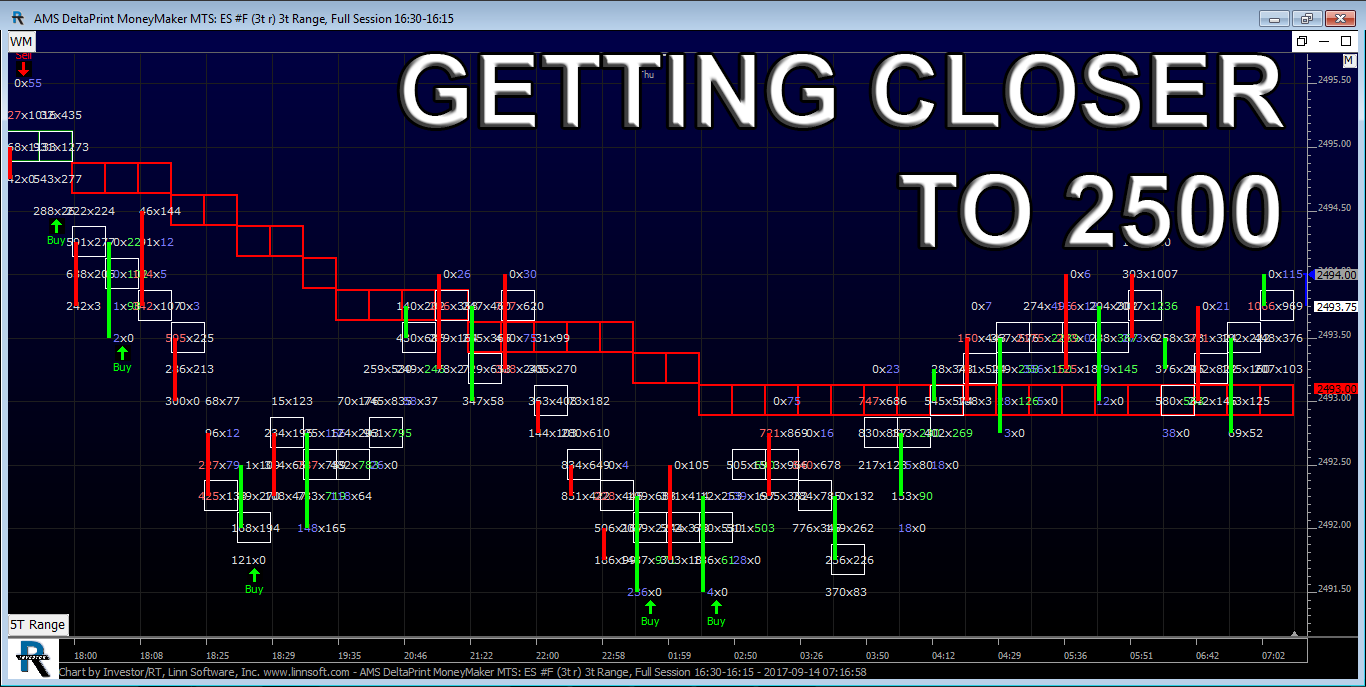
In the U.S., the S&P 500 futures opened last nights globex session at 2494.50, and traded sideways in a 4 handle range for most of the night. As of 7:30 am cst, the ES is starting to find weakness, and is making new lows. The last print in the ESZ is 2490.50, down -4.25 handles, with 156k contracts traded.
In Asia, 9 out of 11 markets closed lower (Shanghai -0.38%), and in Europe 6 out of 12 markets are trading higher this morning (FTSE -0.74%).
Today’s economic includes Consumer Price Index (8:30 a.m. ET), Jobless Claims (8:30 a.m. ET), Bloomberg Consumer Comfort Index (9:45 a.m. ET), and the EIA Natural Gas Report (10:30 a.m. ET).
Our View
Another day, but the story remains the same, thin to win to new all time highs. Buyers on small dips get rewarded, while shorts have to take a quick profit. We know who is in the drivers seat for now. Can it change? Sure, but will it change before the end of the week? Probably not!
Therefore, our view remains the same. It’s a two sided market that favors the bulls above 2490. You can short, if you do so small and take a profit, or you can wait on the thin days for the small 3-5-7 handle pullbacks and buy trying to hold for new all time highs and hopefully leave a runner to 2500.
- In Asia 9 out of 11 markets closed lower: Shanghai Comp -0.38%, Hang Seng -0.42%, Nikkei -0.29%
- In Europe 6 out of 12 markets are trading higher: CAC +0.01%, DAX -0.26%, FTSE -0.74%
- Fair Value: S&P -2.14, NASDAQ +7.74, Dow -41.15
- Total Volume: 609k ESU & 1.4mil ESZ; 16.2k SPU & 16.6k SPZ traded in the pit
