Junk Bond Rout Runs Wild Through Markets
Gold Demand Hits 8 Year Low
US Oil Production Hits Record High
US Government Bonds Close Lower
Dollar Hits 8 Month High vs. YEN
With the S&P up so much, and Trump in Asia, concerns overtook the major U.S. index futures markets.
While I have been very bullish, I also have been saying a pullback is possible as the 3rd quarter earnings season comes to a close. I also said in yesterday’s Opening Print that the S&P hates uncertainty, and that seemed to be the theme during yesterday’s trade. The broad declines had all 11 sectors in the S&P 500 lower.
At its lows, the Dow Jones Futures (YMZ17:CME) were down -231 points, or -1.00%, the S&P 500 futures (ESZ17:CME) were down 27.75 handles, or -1.08%, and the Nasdaq 100 futures (NQZ17:CME) were hit the hardest, down -96.75 points or down over 1.50%.
The main driver came yesterday as the Republicans tried to pass a $1.5 trillion dollar tax cut with the House and Senate moving in different directions. The Senate plan to push a tax bill opposing what the House released last week caused traders to question Republicans ability to get a bill through to the White House. With so many sell stops below, and the ‘headline news algos’ going berserk, the selloff intensified following reports that the Senate tax bill would delay the corporate tax-rate cut until 2019.
It was one sell program after another. After trading down to 91.8 last week the VIX shot up to 12.19, up 25%, its biggest one-day jump since Sept. 5th, forcing futures and options clearing firms to send out margin calls. When this happens it adds additional selling pressure on index options and futures. The traders have three choices 1) Put up more money to hold the positions 2) Roll the long position lower, or 3) Liquidate… All three have a negative effect.
The S&P 500 Has Gone 47 Session Without A Daily Drop Of 0.50% Or More, The Longest Streak Since 1968
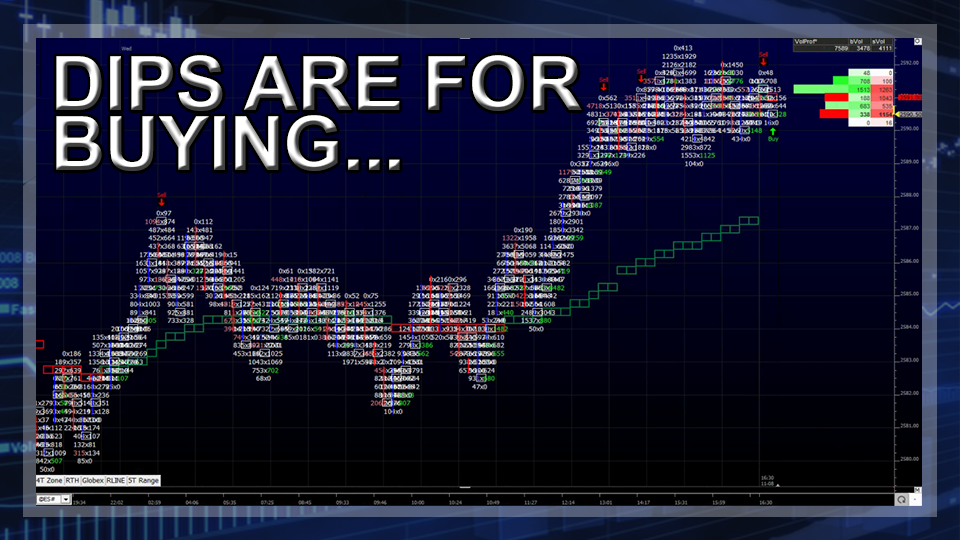
Yesterday, the ES traded down to 2575.50 on Globex, down 15.50 handles, and rallied a little to opened at 2576.25 on the 8:30ct futures open. After the open, the ES moved up to 2580.50, sold off down to 2574.25, and then rallied above the vwap at 2583.00. After another drop down to 2577.25 there was another rally back up to 2583.75 at 10:10 CT, and then in came the tax cut headlines that pushed the ES all the way down to 2563.25 at 11:40, a 20 handle drop in less than an 2 hours.
Once the early low was made, the ES rallied all the way back to 2578.75 at 1:20. At that time, volume had spiked, and 1.8 million ES contracts had traded. After pulling back down to 2575.00 the ES rallied up to 2584.00, down 6.5 handle, or -0.26%, at 2:40 CT. It was a nice comeback for something that had all the earmarks of being a really bad day. It’s funny, as bad as the markets looked, the largest run of the day was buying it.
The MiM went from over $400 million to buy down to $77 million to buy, and the S&P 500 futures (ESZ17:CME) settled at 2584.00, down -7.00 handles, or -0.27%; the Dow Jones futures (YMZ17:CBT) settled at 23,410, down -75 points, or -0.32%; the Nasdaq 100 futures (NQZ17:CME) settled at 6314.50, down -27.00 points, or -0.42%; and the Russell 2000 (RTYZ17:CME) settled at 1431.60, down -4.30 points or -0.30% on the day.
