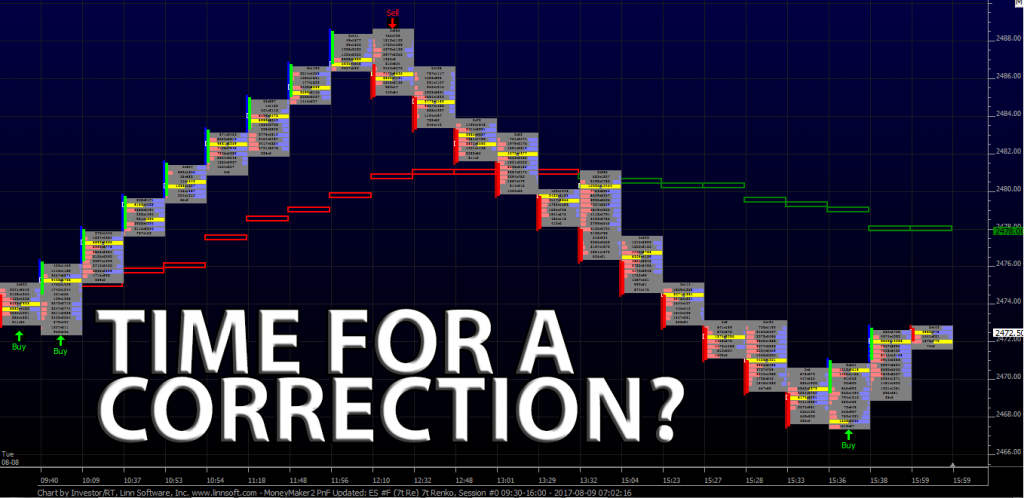
Yesterday, the S&P 500 futures (ESU17:CME) started the day with another narrow, low volume Globex session. On the 8:30 CT futures open the ES trade 2474.25, and then down ticked to an early low of 2472.50, just below the vwap. At 10:11:40 I put this out:
TRADINGDATA2: (driley) The ES and NQ have been back and filling. There are a lot of buy stops in the ES above 2478 up to 2483.-2485.
At 11:04 the ES shot straight up to 2483.00. After a few downticks the ES rallie up to 2485.25, taking out the the stops I posted, and then the next move was up to 2488.50. The Russell 2000 (RTYU17:CME) had been outperforming all day also, it was up +0.85%, while the ES was up +0.40%, and the NQ was up 0.50%.
After the 2488.50 high, the ES get hit by a few small sell programs, pushing the future back down under the vwap to 2477.75 around at around 12:40.
After some sideways price action and three failed attempts to hold above the vwap, the ES started selling off late in the day when the MiM started showing small for sale. At 2:30 CT the ES traded 2470.50 as the MiM was showing $160 million for sale. After the 2470.50 low, the ES up ticked, and then made another new low at at 2468.50, exactly 20 handles off the high. The ES then made another new low at 2467.50, and traded up to 2472.25, as the MiM ‘flipped’ to $125 million to buy. The actual NYSE MOC ended up buy $500 million.
In the end it was a case of running the buy stops early and the sell stops late. The algos had a field day.
August-September Weakness Could be a Positive for the Market
From Stock Trader’s Almanac:
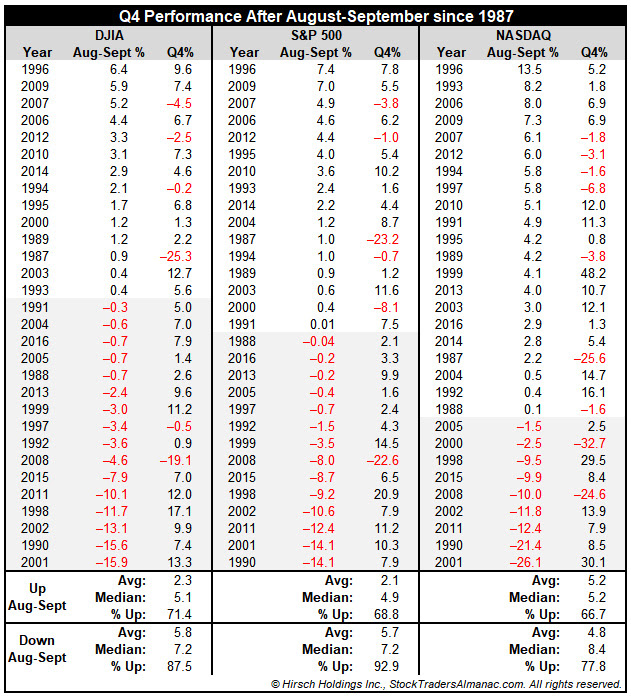
Over the last 30 years (1987 to 2016) August and September combined have been the worst two consecutive months of the year for DJIA, S&P 500 and NASDAQ. August ranks dead last while September has been second worst. This one-two combo has resulted in average losses of 0.2% by NASDAQ to 1.8% by DJIA. S&P 500 average decline has been 1.3%. As recently as 2015 the period was hit with a sizable pullback. In many years, this weakness proved to have been a great buying opportunity.
In the following table, August-September performance by DJIA, S&P 500 and NASDAQ has been ranked from strongest to weakest with subsequent fourth performance. In years when August and September combined for a net loss, fourth quarter average performance more than doubled for DJIA and S&P 500 while the frequency of fourth quarter gains also improved. Of the 14 down August-September periods suffered by S&P 500, just one subsequent fourth quarter was also down, 2008.

Our Tactical Seasonal Switching Strategy currently has the Almanac Investor Stock and ETF Portfolios in a defensive posture with a mixture of long, short and defensive positions along with some cash. Well-chosen defensive positions in healthcare, utilities and bonds have ensured the portfolios have not fallen significantly behind the major indexes during their grind modestly higher the past few months while still being well-aligned to survive any potentially weakness lurking ahead. Our Seasonal MACD Buy Signal will confirm when it is safe to be more aggressive sometime after October 1, well ahead of any fourth quarter or year end rally.
While You Were Sleeping

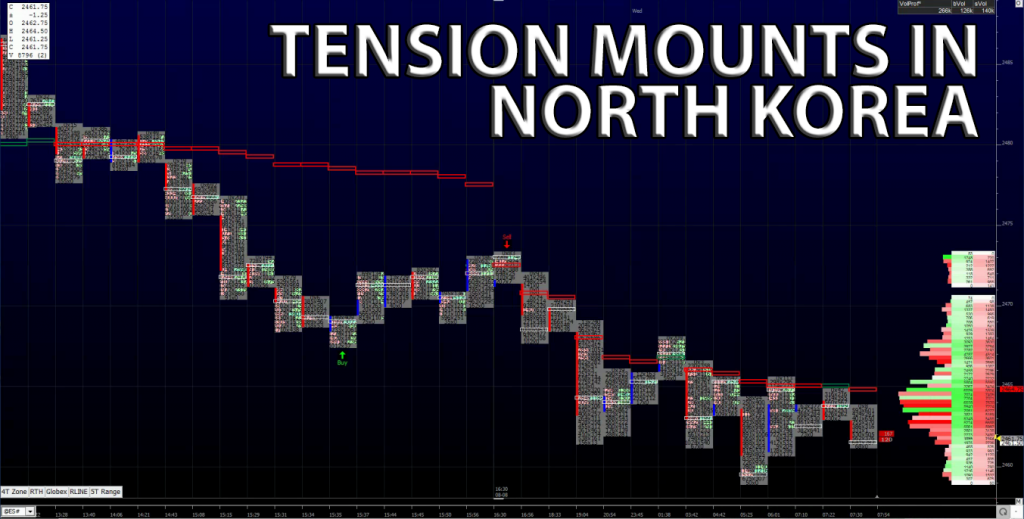
Overnight, stocks traded lower across the board, as tension continues to build with North Korea. As of 6:45am CT, the last print in the S&P 500 futures is 2463.00, down -9.75 handles, with 250k contracts traded.
In Asia, 7 out of 11 markets closed lower (Shanghai -0.19%), and in Europe 11 out of 12 markets are trading lower this morning (FTSE -0.81%).
Today’s economic calendar includes MBA Mortgage Applications (7:00 AM ET), Productivity and Costs (8:30 AM ET), Wholesale Trade (10:00 AM ET), EIA Petroleum Status Report (10:30 AM ET), Chicago Fed’s Charles Evans Speaks (1:00 PM ET), and a 10-Year Note Auction (1:00 PM ET).
Earnings: Mylan (NASDAQ:MYL), Office Depot, Scripps Networks, Starwood Property Trust, Sun Life, Tribune, Twenty-First Century Fox, US Foods.
Time For A Pull Back
Our View: One of the things the markets have done is overlook a lot of the geopolitical risk, but how long can that go on? The North Korea headline may have had something to do with the late weakness, but how much is hard to say. After running all the stops I have been talking about, and the 2488.50 high, I think a short term top could be in. Mondays total volume was only 580,000, and yesterday’s was 1.35 million, that’s a big increase.
So, in a world of ‘what goes up must come down’, we want to see how the markets act, but our view is to sell the rallies. 2488.50 could be it for now.
PitBull: CLU osc 0/16 turns up on a close above 50.15; ESU osc 4/14 turns down on a close below 2469.46; VIX osc 3/-1 turns down on a close below 10.05.

