To The Opening Print Readers:
We have decided to retool the Opening Print. We will not be doing the lengthy overview of the E-Mini S&P 500 futures daily ups and downs, and will instead do a condensed version of the days trade.
The emphasis will be on streamlining the top part of the Opening Print, and including a new section for the MrTopStep MiM, as well as an additional market news piece. MrTopStep is dedicated to providing you with straight forward trading information and news.
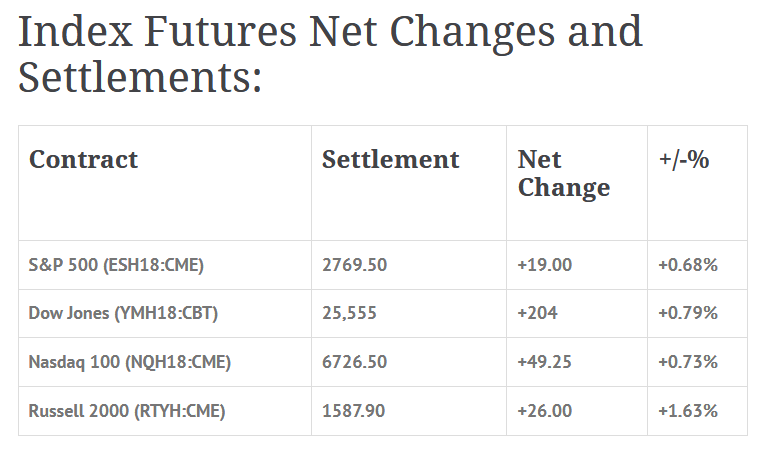
Foreign Markets, Fair Value and Volume:
- In Asia 8 out of 11 markets closed higher: Shanghai Comp +0.12%, Hang Seng +0.94%, Nikkei -0.24%
- In Europe 8 out of 12 markets are trading higher: CAC +0.24%, DAX +0.13%, FTSE +0.20%
- Fair Value: S&P +0.36, NASDAQ +10.96, Dow -26.47
- Total Volume: 1.0mil ESH & 980 SPH traded in the pit
Today’s Economic and Earnings Calendar:
Consumer Price Index, 8:30 a.m. Eastern; Retail Sales, 8:30 a.m.; Business Inventories, 10 a.m.; Baker-Hughes Rig Count, 1 p.m. Fedspeak: Patrick Harker Speaks, 12:30 p.m.; Eric Rosengren Speaks, 4:15 p.m. Earnings: BlackRock, 5:45 a.m. (approx.); PNC Financial (NYSE:PNC) Services, 6:30 a.m.(approx.); JPMorgan Chase (NYSE:JPM), 6:45 a.m. (approx.); Wells Fargo (NYSE:WFC), 8 a.m.
Thursday’s Trade: Buy S&P / Sell 10-Year Note
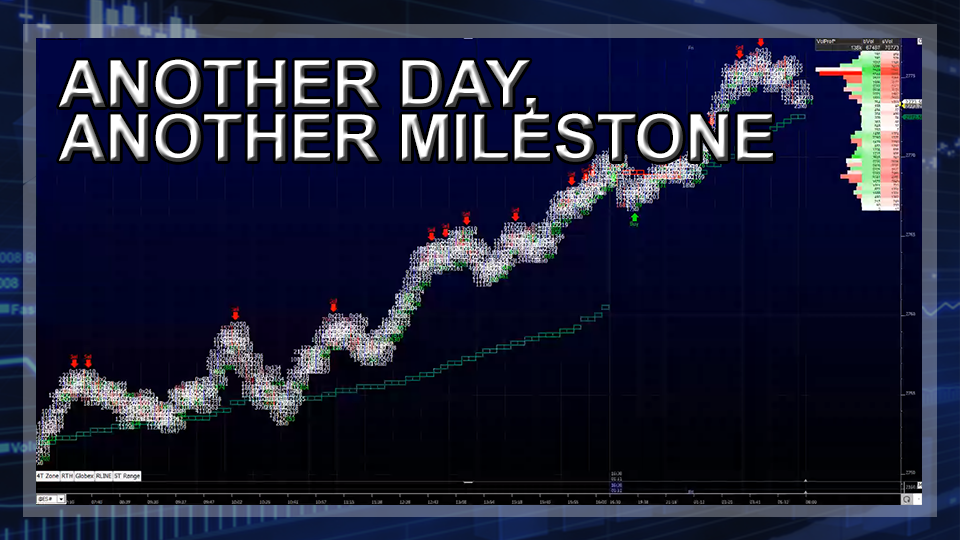
On Wednesday night’s Globex session, the ES rallied up to 2756.50, on low volume. After a few drops under the vwap at the 2753.00 area, the ES rallied up to 2759.50, two ticks shy of Tuesdays 2760.00 new all-time high. From there, the ES sold back off to a higher low at 2753.25, and then traded back to the contract high at 2760.00 around 10:15 CT. After a 3 handle pullback, the ES made 3 separate new highs by 1 tick at 2764.25, 2764.50, and 2764.75, pulled back down to 2763.00, and then made two more new highs at 2765.25 and 2765.50.
This is clearly a continuation of the current upside pattern that started at the beginning of 2018. The big trade so far this year has been buying stocks and selling U.S. government bonds. Bond selling has pushed the yield on the benchmark 10-year Treasury note above 2.5%, its highest closing level in nearly 10 months.
The markets continue to surge. Energy stocks have risen 6.2% this year, the best of any sector in 2018. In terms of the stock markets overall tone, there seems to be no sign of letting up. The PitBull said he has not seen anything like this “since 1987,” and I have to agree.
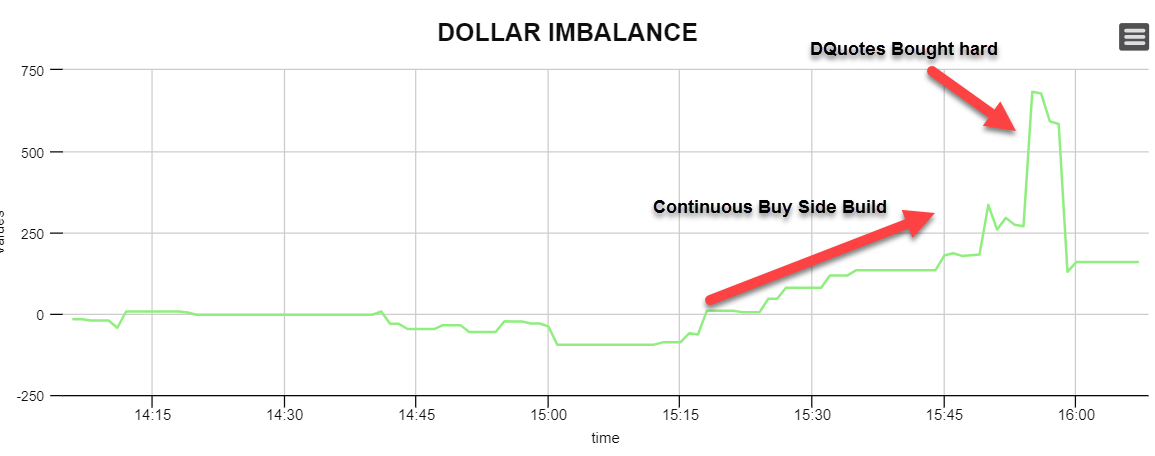
The (MiM) MrTopStep Imbalance Meter
Our closing imbalance meter (MiM) showed a building buy side into the close. The D-quotes bought hard pushing a small buy side imbalance up to 600M. There is still money coming into the markets.
Keystone Charts – Bitcoin
South Korea justice minister said “There are great concerns regarding virtual currencies and the justice ministry is basically preparing a bill to ban cryptocurrency trading through exchanges.” But, this process could take many months. The SK presidential office said the bill hasn’t been finalized yet. “The issue of banning exchanges that the justice minister talked about yesterday is a proposal by the Justice Ministry and it needs more coordination among ministries,” Minister Kim Dong-yeon said, adding that discussion was under way on how the government could regulate crypto trading.
The Bitcoin Real Time Index is holding above the short term .786 support and 50dma which has been pivotal.
CBOT Bitcoin future is holding this hourly trend line overnight which may see some upside momentum above it.
While You Were Sleeping
Overnight, equity markets in Asia and Europe traded mostly higher across the board, with the Hang Seng Index leading the way closing up +0.94%.
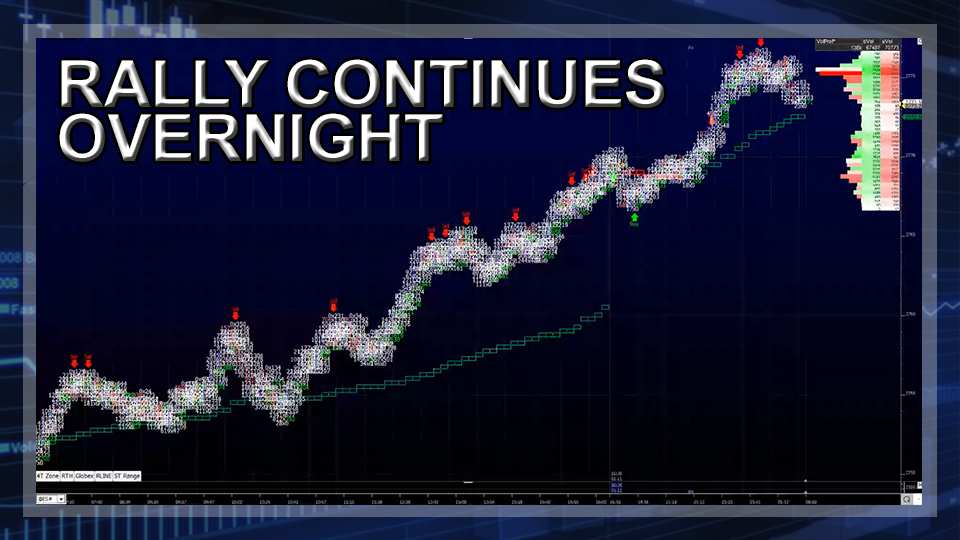
In the U.S., the E-Mini S&P 500 futures opened last nights Globex session at 2768.75, down -0.75 handles. The initial move off the open was down, printing a low at 2766.75 in the first hour of trading. The ES fought back from the early weakness, and by 3:30 AM CT had printed a high at 2776.75, completing a MrTopStep 10 handle rule. As of 7:00 AM CT, the last print in the ES is 2773.50, up +4.00 handles, with 126k contracts traded.
Sentiment At 30 Year High / VIX At 50 Year Low
Our View: There is an old song called “How long has this been going on?”… The answer is, since March of 2009. Thats nine years of going up, or in S&P 500 terms, an over a 300% gain. It’s unbelievable, and so is the bullish sentiment, which is on a 30 year high. In ‘normal times,’ when sentiment is this high the S&P sells off, but there is nothing normal about this. The big institutions are unloading bonds and buying stocks in size. The VIX is at a 50 year low, which seems to be the new normal.
Our view is we lean to lower prices today. Not a big down day, but a pullback. With the ES up 102.50 handles in 8 sessions, we don’t think the it can keep going up as it has. According to the S&P cash study for the January options expiration, the friday the week before the expiration has been up 15 / down 19 of the last 34 occasions.
PitBull: CLG Osc 44/31 turns down on a close below 64.86; ESH Osc 46/20 turns down on a close below 2777.82; VIX Osc 4/-2 turns down on a close below 9.90.
Disclaimer: Trading Futures, Options on Futures, and retail off-exchange foreign currency transactions involves substantial risk of loss and is not suitable for all investors. You should carefully consider whether trading is suitable for you in light of your circumstances, knowledge, and financial resources. Any decision to purchase or sell as a result of the opinions expressed in the forum will be the full responsibility of the person(s) authorizing such transaction(s). BE ADVISED TO ALWAYS USE PROTECTIVE STOP LOSSES AND ALLOW FOR SLIPPAGE TO MANAGE YOUR TRADE(S) AS AN INVESTOR COULD LOSE ALL OR MORE THAN THEIR INITIAL INVESTMENT. PAST PERFORMANCE IS NOT INDICATIVE OF FUTURE RESULTS.


