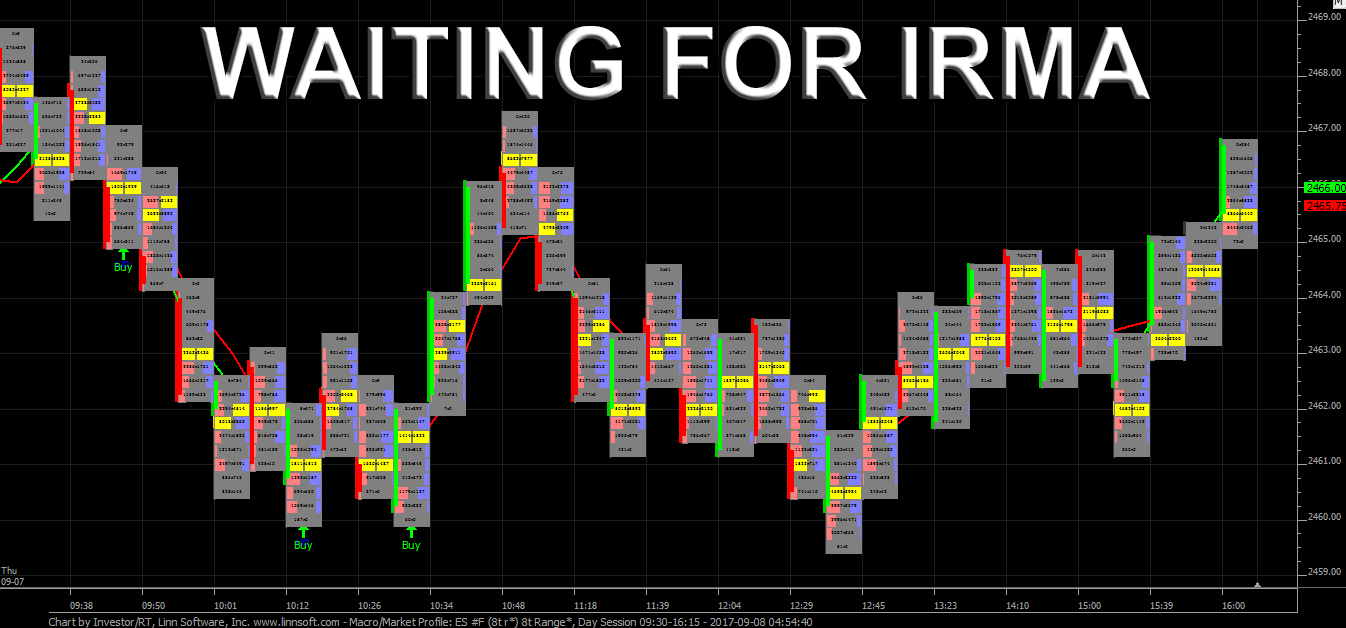
After rallying late in the Globex session on Thursday, the S&P 500 futures (ESU17:CME) opened the 8:30 am cst cash session at 2468.50, up 2.50 handles. The high of the day at 2468.75 was printed on the open, before getting hit with an early wave of selling that pushed the benchmark futures down to an early first hour low of 2460.00. After rebounding back up to 2467.25, another sell program hit, pushing the index futures down to a new low of 2459.50 after 11:30 am cst.
After the midday low, the ESU quietly pushed higher into the afternoon before making a late day push to 2466.75, failing to retake the open before settling the day at 2466.75, up three ticks from the prior days close, with the market-on-close imbalance at $450 million to buy.
As the roll from the September to December contract really got under way yesterday, the “water in the bathtub” effect was in play, as the futures stayed in between the prior days range. Going into today’s session the calendar is light, the contract roll will continue to be underway, but with Hurricane Irma approaching in the hours to come, and with it being the Friday before the week of quad witch expiration, we could see some selling.
End of summer driving could signal trouble ahead for crude oil
From Stock Traders Almanac
Seasonally speaking, crude oil tends to make significant price gains in the summer, as vacationers and the annual trek of students returning to college in August creates increased demand for unleaded gasoline. The market can also price in a premium for supply disruptions due to threats of hurricanes in the Gulf of Mexico. However, towards mid-September, we often see a seasonal tendency for prices to peak out, as the driving and hurricane seasons begin to wind down. Crude oil’s seasonal decline is highlighted in yellow in the above chart.
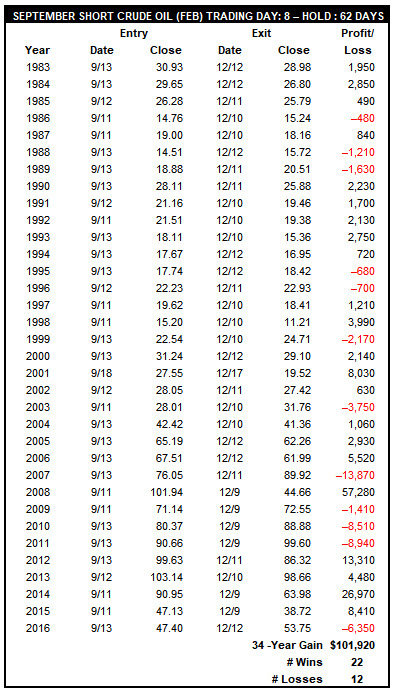
Shorting the February crude oil futures contract in mid-September and holding until on or about December 10 has produced 22 winning trades in the last 34 years. This gives the trade a 64.7% success rate and theoretical total gains of $101,920 per futures contract. Following three consecutive years of losses, this trade has been successful in four of the last five years.

It has been over three years since crude last traded above $100 per barrel. Ample supply and inventories have largely keep price under $50 per barrel ever since. Even hurricane Harvey had just a modest impact on crude’s price. Gasoline did spike, but crude did not. Crude’s failure to respond suggests it next move could easily be lower especially as summer driving season demand begins to fade.
While You Were Sleeping

Overnight, equity markets in Asia traded mixed, with a slight bias to the upside. Meanwhile, in Europe, most majors are trading lower this morning, led by the PSI 20 Index, which is down -1.07%.
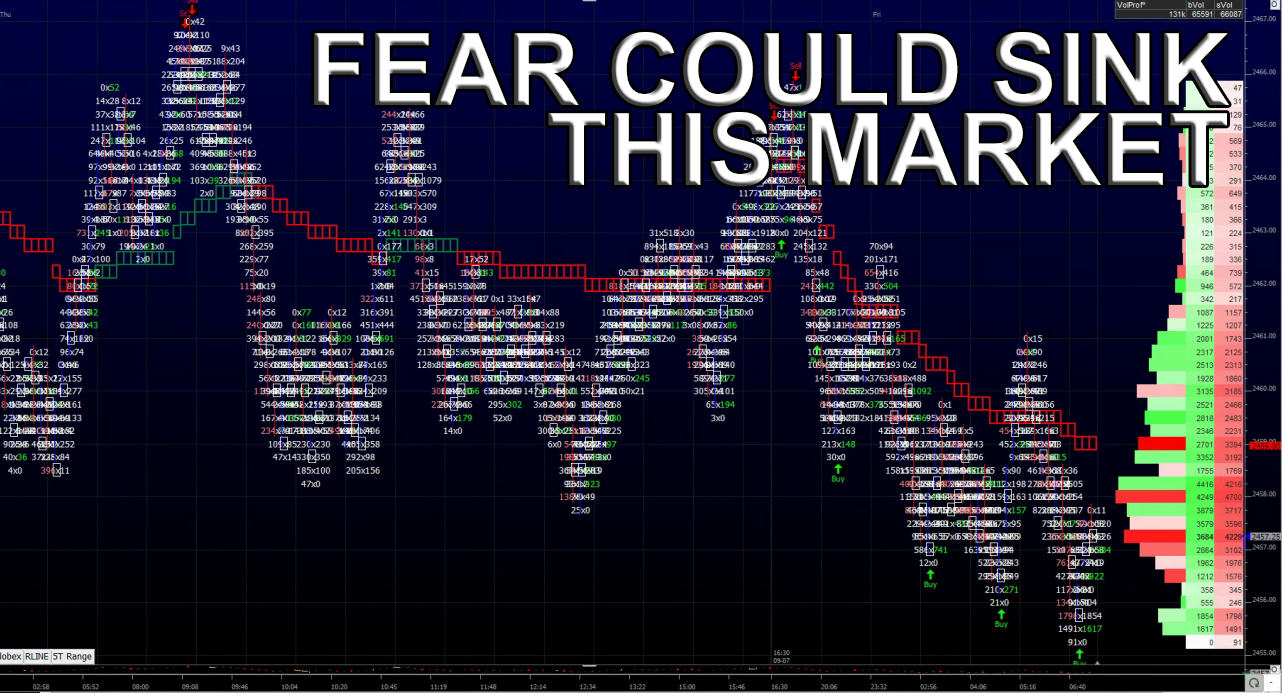
In the U.S., the S&P 500 futures opened last night’s globex session at 2466.50, and printed the overnight high at 2467.50 within the first hour of trading. From there, it was a steady grind lower for the rest of the night, with the low at 2456.75 printing at 5:45am CT. As of 6:45am CT, the last print in the ESU is 2459.00, down -7.50 handles, with 136k contracts traded.
In Asia, 6 out of 11 markets closed higher (Shanghai -0.01%), and in Europe 10 out of 12 markets are trading lower this morning (FTSE -0.41%).
Today’s economic calendar includes Patrick Harker Speaking, Wholesale Trade, the Baker-Hughes Rig Count, and Consumer Credit.
Our View
Quiet before the storm? The futures seem to be caught on a trip to nowhere. We see resistance at 2464 and 2466.50, and then this week’s high of 2469.50. However, above 2470, we think there are buy stops that will push this market up to 2474 very quickly.
To the down side, the 2459 – 2455 area has been holding well since the early week low, and with the close of the week, the seasonal weak period, the unknowns surrounding the storm over the weekend, and with it time to look for the PitBull low the week before expiration, and the inability for the ES to fill the gap this week, all these factors could contribute to a risk off move.
Below 2455 we see buy stops that will push the market down to this week’s 2443.75 low.Our call is to buy the light early weakness at 2459 – 2455 area, looking to sell rallies at 2464 and above. But if 2455 breaks, we only want to be short into the end of the day.
PitBull: CLV osc 28/-6 turns down on a close below 48.98; ESU osc 10/ turns up on a close 2470.99; VIX osc 6/-5 turns down on a close below 11.95.

