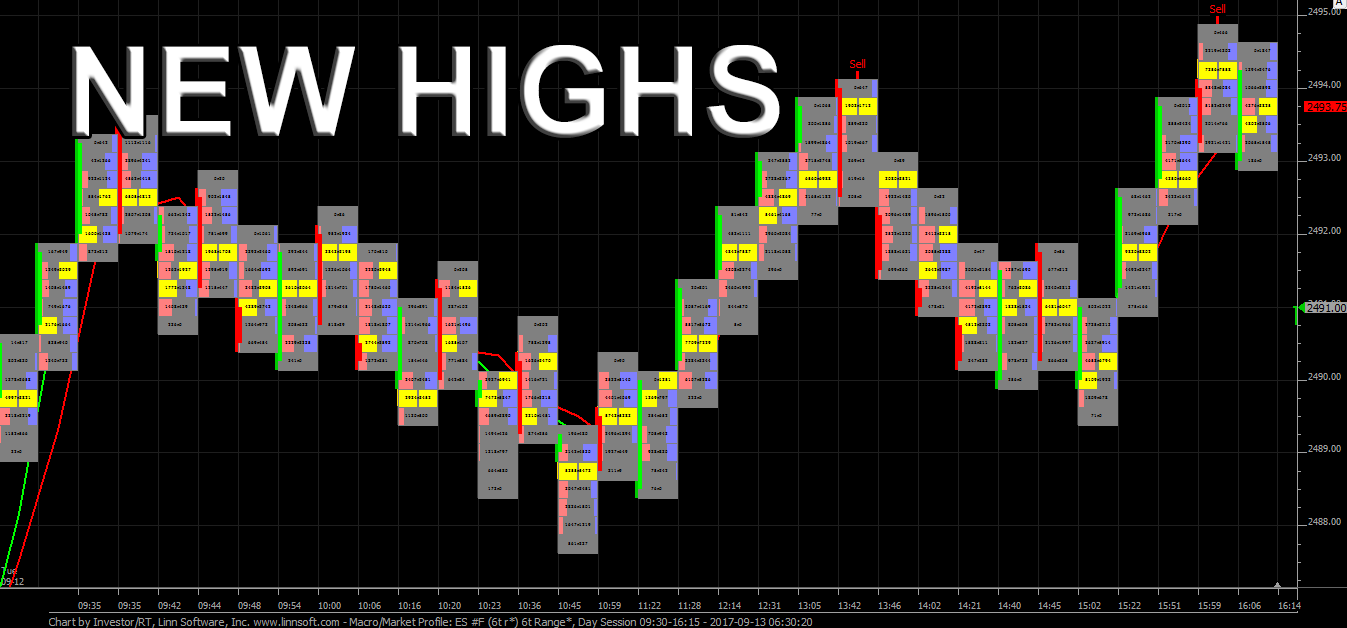
After once again pushing higher in the Globex session, the S&P 500 futures (ESZ17:CME) opened the 8:30am CT regular session at 2489.75, up 4.5 handles, made a low three ticks below the open and then rallied on the open printing to a new all time high of 2493.50 in the first half hour of the session. After 9:00am the futures took a breather, selling down below the open to a new low of day at 2487.75 just after 9:30am, before regrouping to make another upward push into the midday. The ESZ made it’s way up to 2494.00 just after 12:30 before trading back lower again down to the open at 2489.50 after 2:00 pm. In the final hour the S&P’s once again rallied, storming up to a new 2394.75 all time high, before settling the day at 2494.25, up 7.75 handles, with the market-on-close imbalance at $237 million to sell.
All in all, it was mostly more of the same, and in line with how we started calling the week back on Monday when we called for new all time highs, and gave a 2500 target on the S&P. However, we also said it would be slower above 2490, and it would be more two sided there, especially on the first couple touches, and that is what we saw yesterday, as it seems bulls don’t want to initiate many longs above 2490, and bears start to come in to defend the 2500 area. However, buyers were ready just below 2490, and on each pullback the bears who got sucked in got pushed around back above 2490.
Despite New Highs Typical September Action Ripe for Fall
From Stock Traders Almanac
Folks have been questioning recently the validity and efficacy of seasonal market patterns as the equity markets have shown resiliency over the worst six months and the major indices log new highs, except for the Russell 2000. I have been hearing a good bit of frustration with our worst six months seasonality and out rather cautious stance. But it is at times like this when traders and investors throw in the towel on these evidence-based patterns that they often come home to roost.
We have cited recently many of the fundamental, technical, psychological and geopolitical risks and reasons the market is ripe for a correction in addition to the seasonals. Our Best Six and Eight Month Switching Strategies have served us and our clients and subscribers well over the long and short terms.
So while the market has held up pretty well since “Sell in May” it has not done much since our June 9 NASDAQ MACD Sell Signal when we went more fully risk off. At that time we held our big winners, sold underperformers, tightened up stops, limited new longs and implemented some defensive positions. After logging double-digit gains from our October 24 MACD Buy Signal, since June 9 DJIA is up 4.0%, S&P 500 2.7%, NASDAQ 4.0% and the Russell 2000 0.1%.
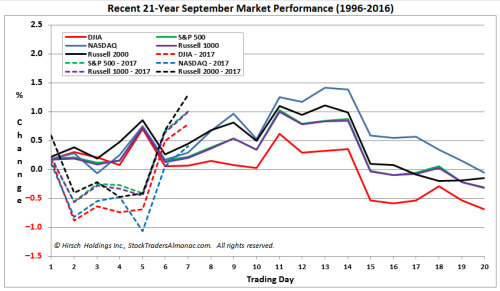
In addition, September may look extremely robust on first blush, but look at the update chart below of a typical September with 2017 so far overlaid. It still looks like we are on track for a late month selloff, or at least set up for some month-end softness.

While You Were Sleeping

Overnight, equity markets in Asia traded mixed, with a slight bias to the downside, and were led by the JSX Composite, which closed down -0.45%. In Europe, stocks are also trading mixed this morning, with the PSI 20 Index trying to hold things up at +0.43%
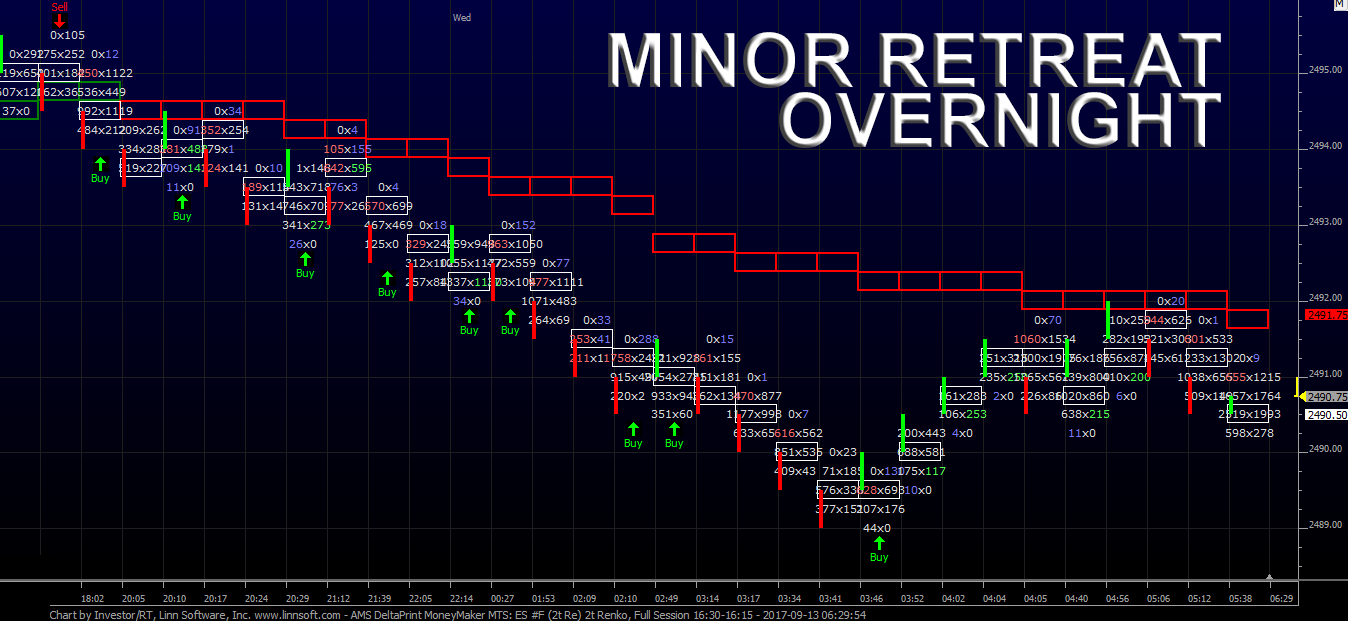
In the U.S., the S&P 500 futures opened last nights globex session at 2495.00, and printed the overnight high at 2495.50 in the first few minutes of trading. From there, it was a slow grind lower, with the low print at 2489.00 being made just before 3:00am CT. As of 7:20am CT, the last print in the ESZ is 2490.75, down -3.50 handles, with 235k contracts traded.
In Asia, 8 out of 11 markets closed lower (Shanghai +0.18%), and in Europe 6 out of 12 markets are trading higher this morning (FTSE -0.24%).
Today’s economic includes MBA Mortgage Applications (7:00 a.m. ET), PPI-FD (8:30 a.m. ET), and the EIA Petroleum Status Report (10:30 a.m. ET).
Our View
Since printing a new high on the Globex open last night, the ES has been sideways to lower for much of the session. The PitBull had an old rule about buying the third day of a rally, and that it doesn’t often work too well. He also has a rule about finding a low the Thur/Fri the week before expiration, and that rule nailed it again.
Above 2490 we see it as a two sided market. We would rather buy dips in the 2480’s and be long above 2490 as the grind to 2500 will continue. However, if you miss the dip to buy, don’t short too early. Pick your short spot, stay small, and take a profit if you must counter trend trade.
Other than that, we are watching the 2488, 2485, and 2483 area’s for buying, as long as any selling momentum is relatively orderly and light volume.

- In Asia 8 out of 11 markets closed lower: Shanghai Comp +0.18%, Hang Seng -0.28%, Nikkei +0.45%
- In Europe 6 out of 12 markets are trading higher: CAC +0.14%, DAX +0.17%, FTSE -0.24%
- Fair Value: S&P -2.37, NASDAQ +7.86, Dow -41.82
- Total Volume: 1.03mil ESU & 1.73mil ESZ; 16.2k SPU & 16.6k SPZ traded in the pit
