Selloff or Market Correction? Either Way, Here's What to Do NextSee Overvalued Stocks

S&P 500 Earnings And Market Update

Published 11/24/2020, 12:34 AM
Updated 07/09/2023, 06:31 AM
US500
-
DJI
-
IXIC
-

The forward looking earnings per share for all S&P 500 companies combined ticked down from $159.92 to $159.89 last week.
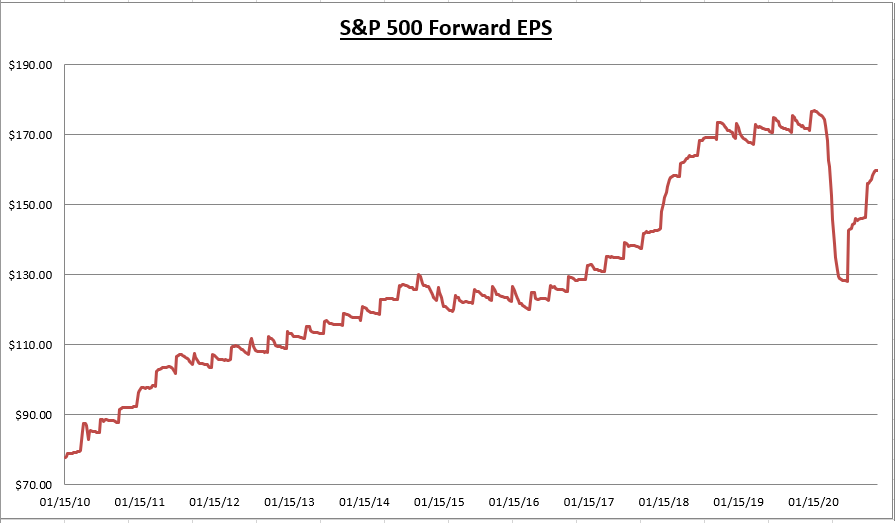
S&P 500 Forward EPS Chart

The trailing twelve month (TTM), or earnings already reported over the last 12 months rose from $141.74 to $142.20.
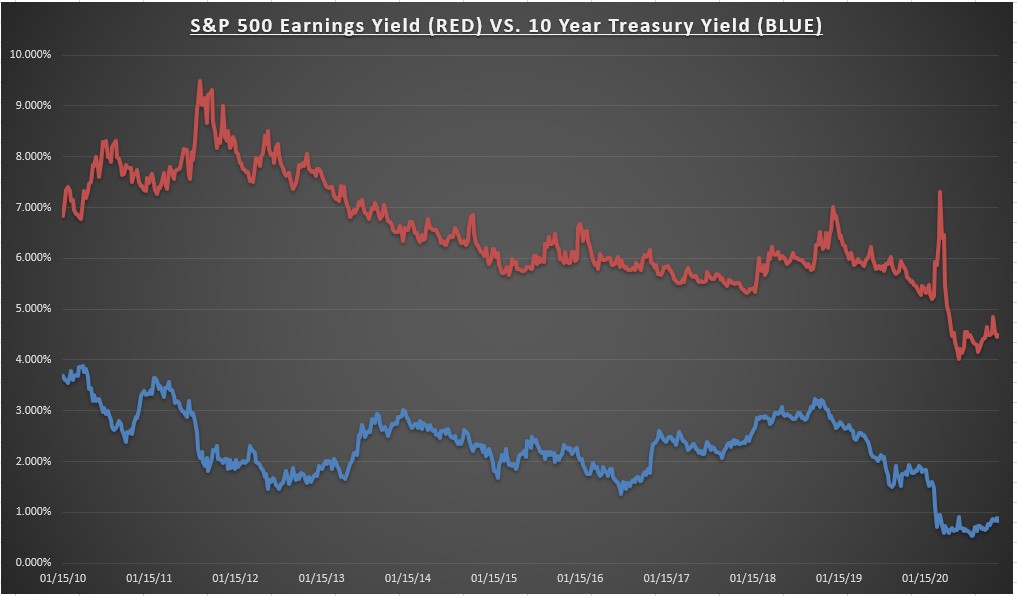
S&P 500 Earnings Yield Vs 10 Year Treasury Yield

The S&P 500 index declined 0.80% last week, so the earnings yield moves up to 4.49%, and the price to earnings ratio declines to 22.2.

For Q3, 95% of companies have now reported earnings. 84% have beat earnings expectations, and beating expectations by 19.5%. 78% of companies have beat revenue expectations. (Factset)
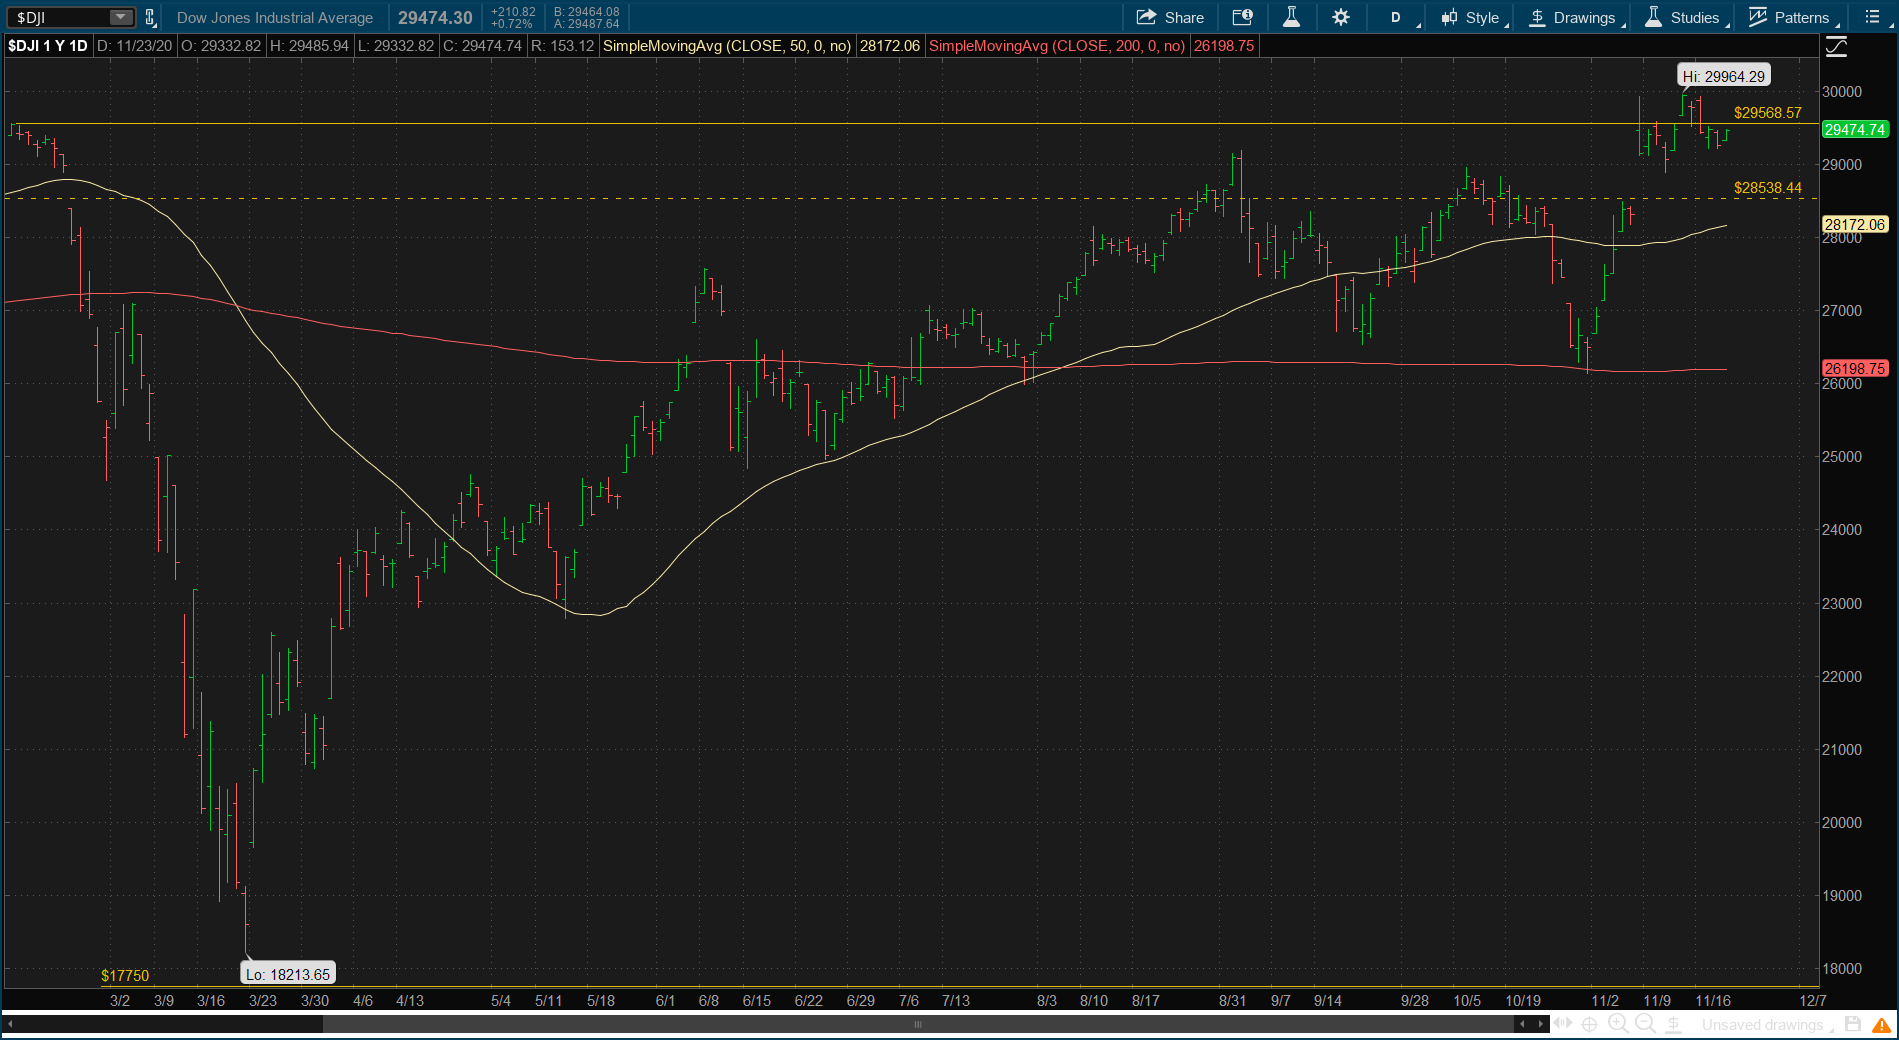
DJI Daily Chart

The indexes are all flirting with recent all time highs. The Dow finally broke above its pre-COVID intraday highs at 29,568.57.
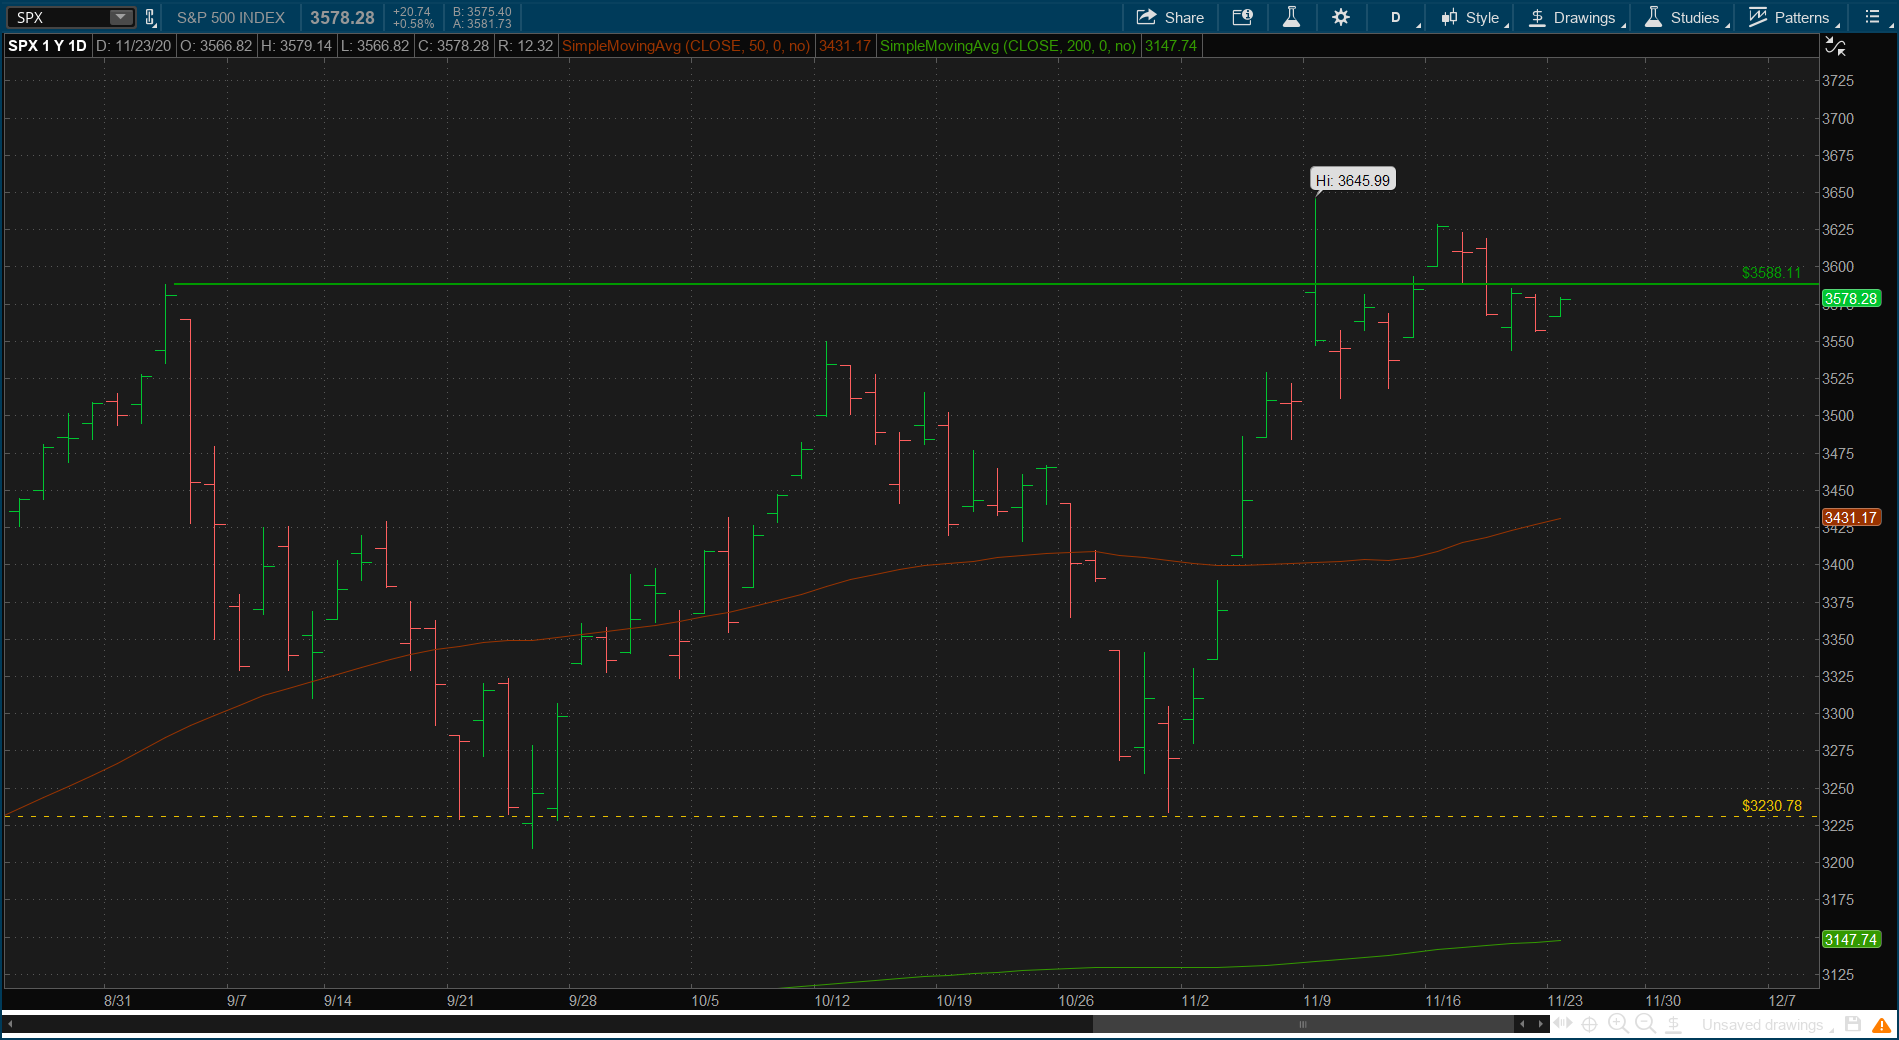
SPX Daily Chart

The S&P 500 broke above its prior intraday highs at 3588.11 on the vaccine news two weeks back.

The short term trading setup here is to use the prior highs as a bull/bear line in the sand. Bullish above/bearish below. If price can’t establish itself above a prior swing high, a correction may be in order to find buyers for the next leg higher.
NDX Daily Chart

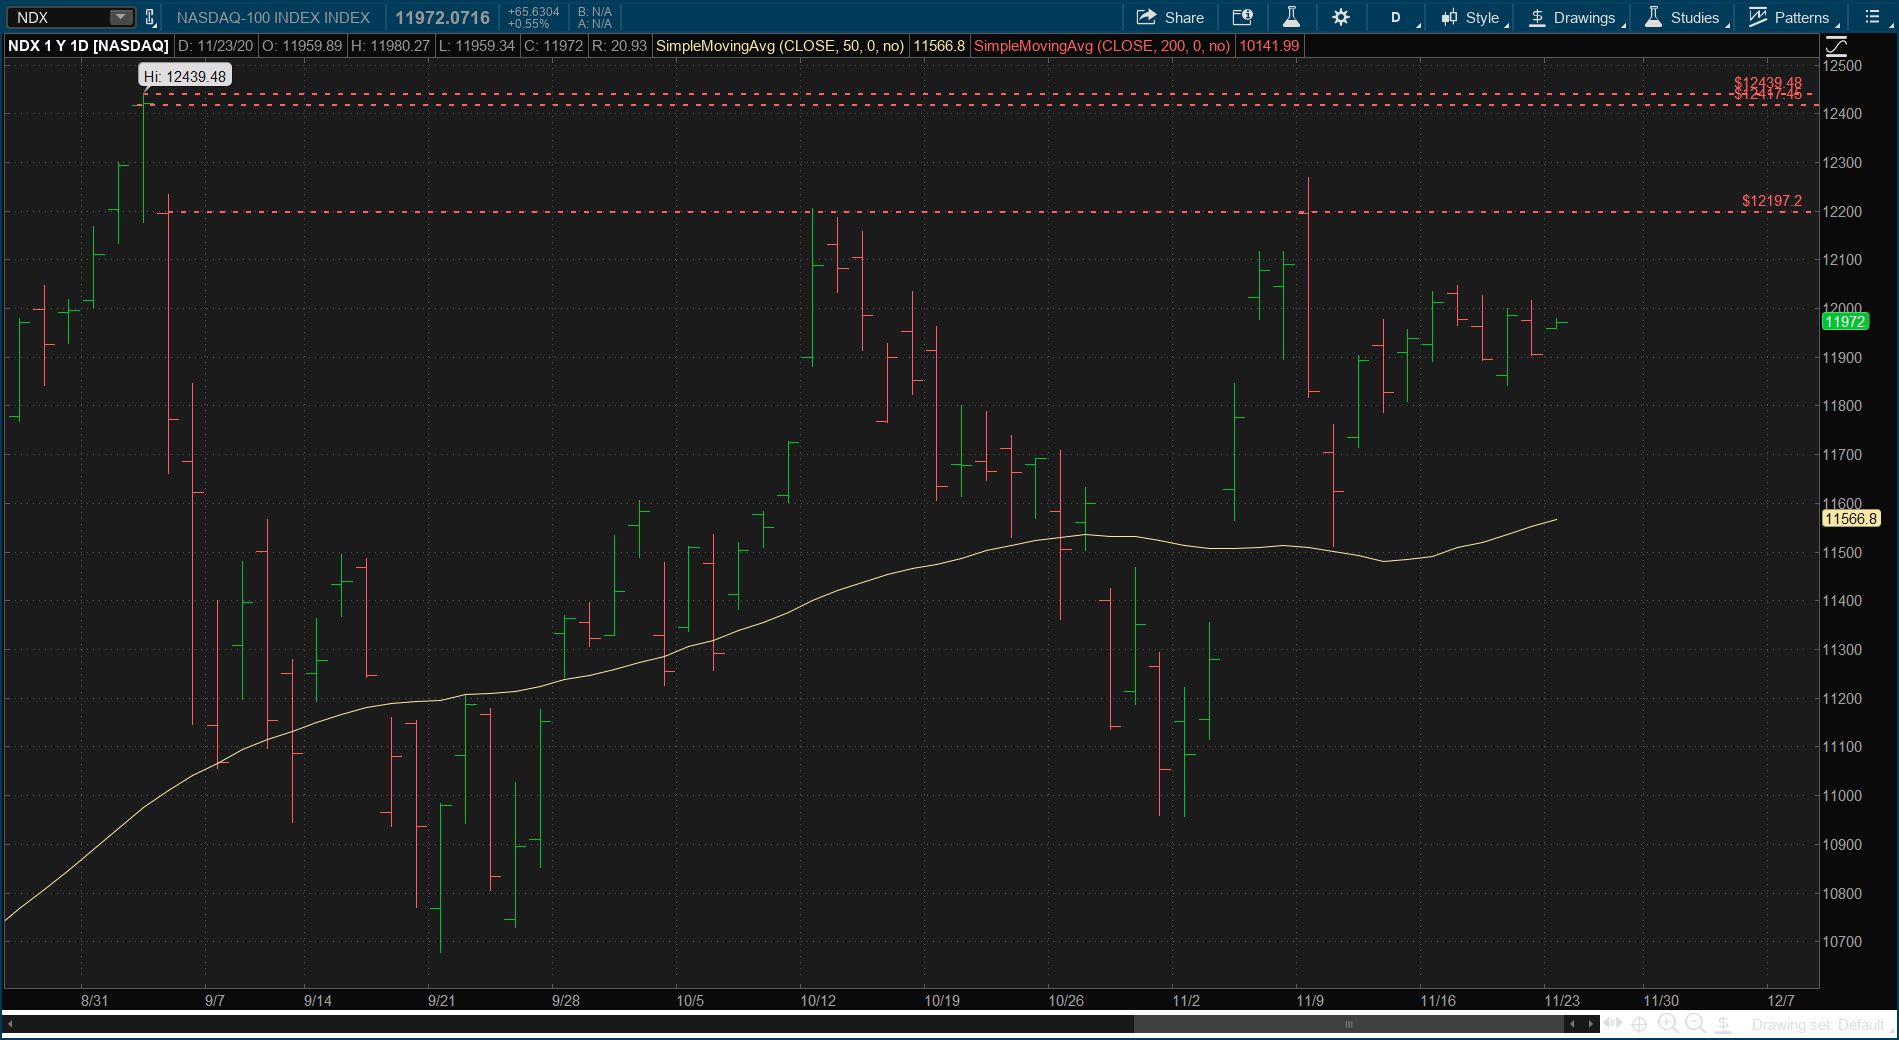
The NASDAQ is the laggard as the rotation to value and small caps continues. It’s still got a ways to go to retake prior all time highs and continues to show some weakness.
RUT Weekly Chart

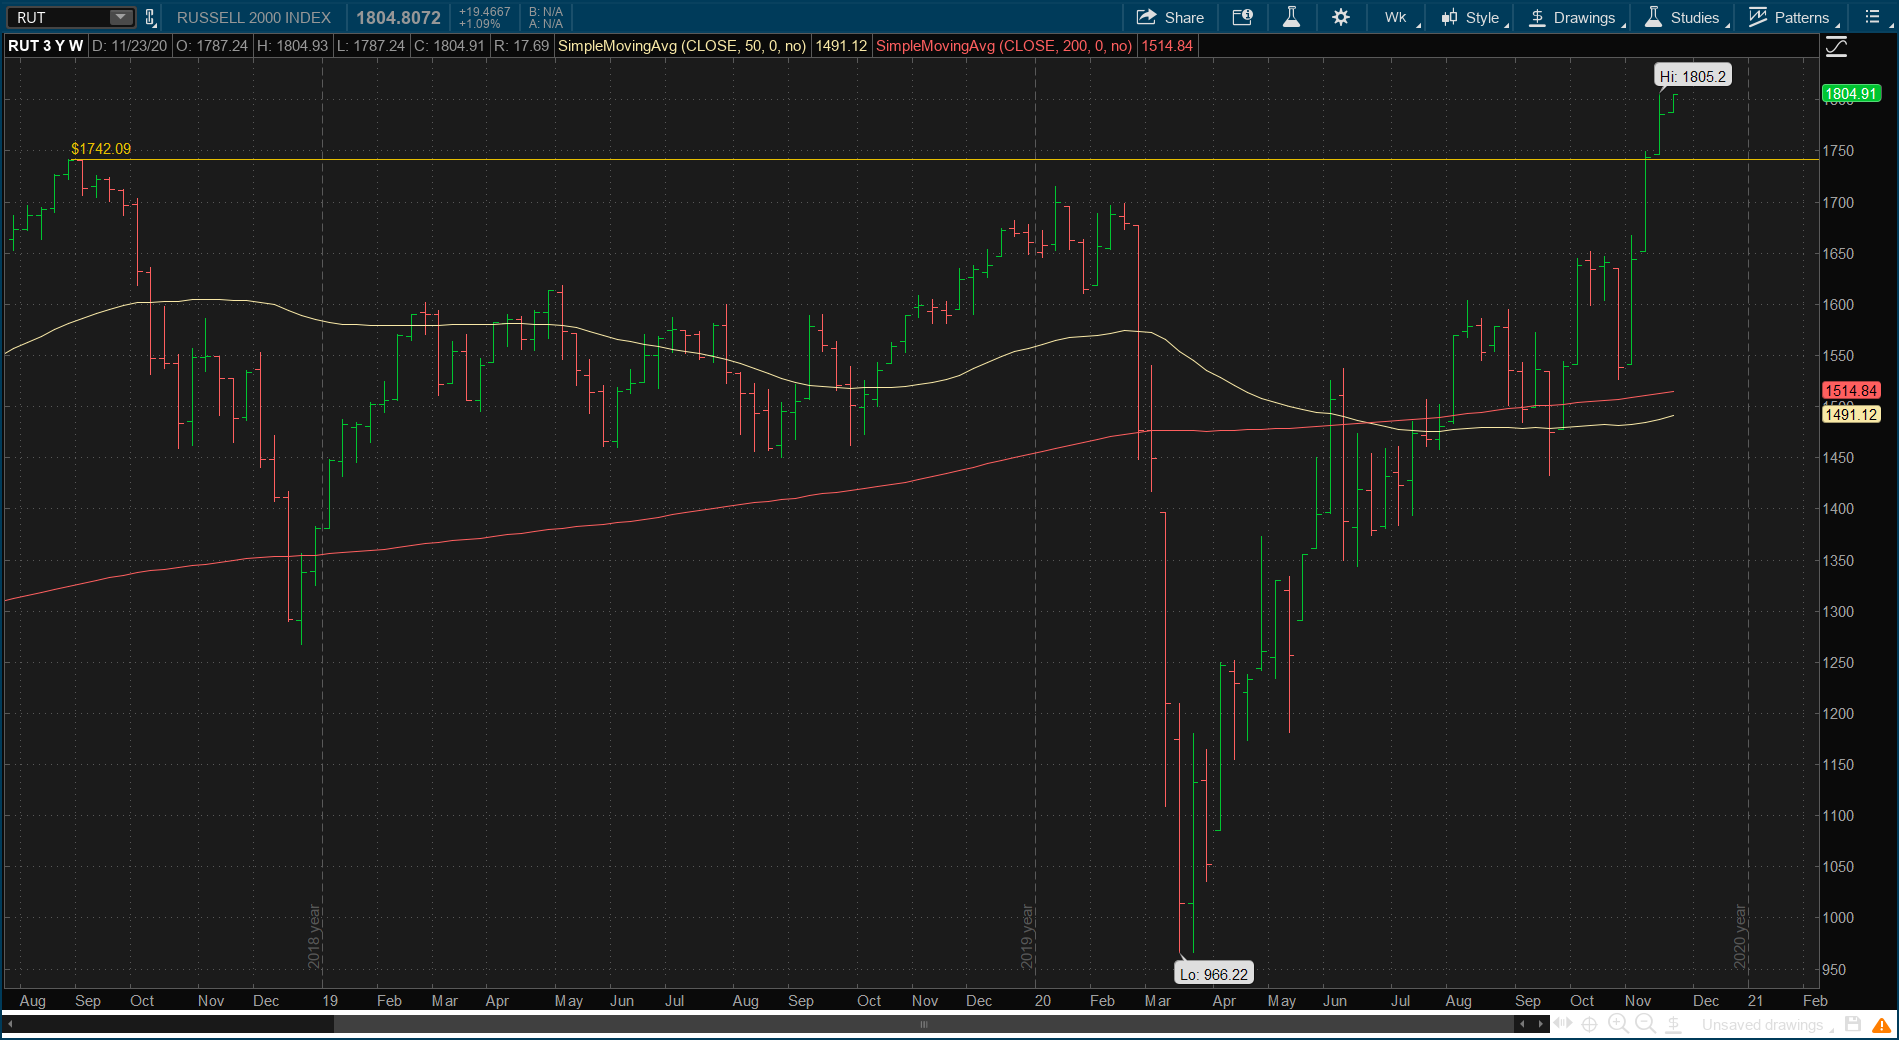
The bright spot is the russell 2000 small cap index. For two years this index failed to make a new high but has seemed to establish itself above.
NYAD Chart

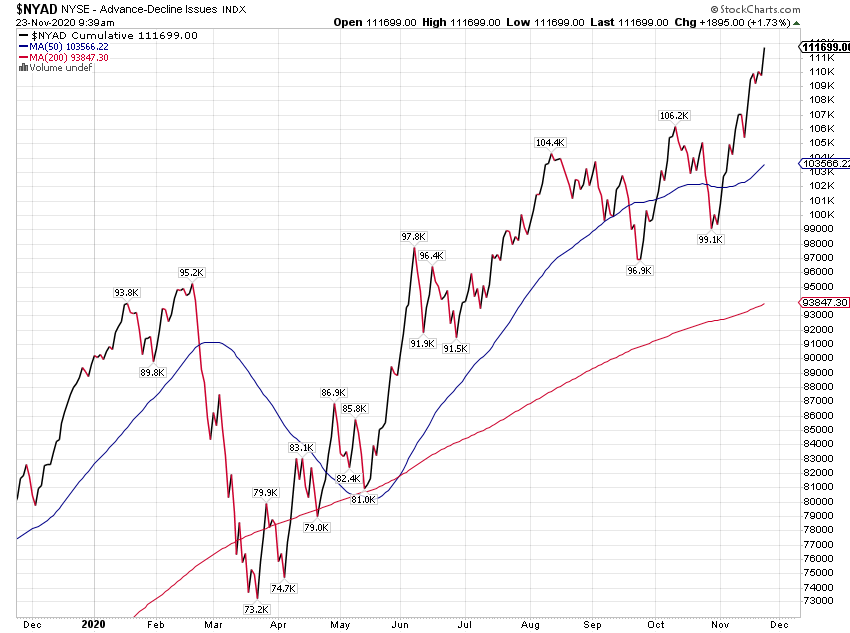
Couple this with the strong market internals, as the advance decline line continues higher, and it is hard to get overly bearish. This is typically not what you see before an important market top. But then again, nothing about 2020 has been typical.
Weekly Unemployment Claims Graph

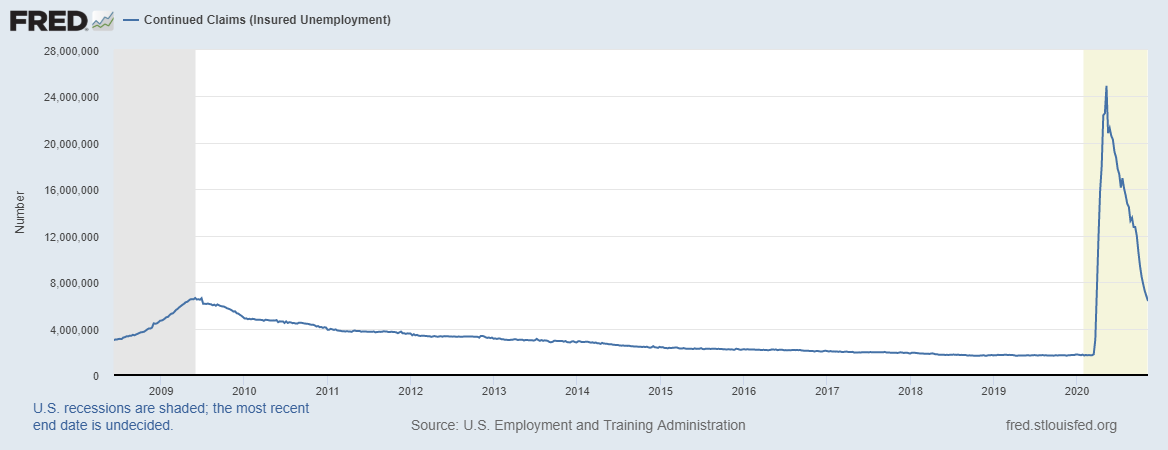
Last week, weekly unemployment claims ticked up to 742k and continuing claims (although trending lower) are still above the peak of the 2008 recession. There are some undertones in recent economic reports that highlight the uncertainty and potential disruptions this could cause by end of 2020 and into Q1 2021.

As of right now, Q4 GDP is coming in around 5.6% but there is still a ways to go. Market technicals are solid and the economic recovery is intact, but the employment picture is still in recession and keeps downside risks elevated.

This holiday shortened week is light on earnings but some key economic data points like consumer confidence and new home sales will be released.

Latest comments

Loading next article…
Risk Disclosure: Trading in financial instruments and/or cryptocurrencies involves high risks including the risk of losing some, or all, of your investment amount, and may not be suitable for all investors. Prices of cryptocurrencies are extremely volatile and may be affected by external factors such as financial, regulatory or political events. Trading on margin increases the financial risks.
Before deciding to trade in financial instrument or cryptocurrencies you should be fully informed of the risks and costs associated with trading the financial markets, carefully consider your investment objectives, level of experience, and risk appetite, and seek professional advice where needed.
Fusion Media would like to remind you that the data contained in this website is not necessarily real-time nor accurate. The data and prices on the website are not necessarily provided by any market or exchange, but may be provided by market makers, and so prices may not be accurate and may differ from the actual price at any given market, meaning prices are indicative and not appropriate for trading purposes. Fusion Media and any provider of the data contained in this website will not accept liability for any loss or damage as a result of your trading, or your reliance on the information contained within this website.
It is prohibited to use, store, reproduce, display, modify, transmit or distribute the data contained in this website without the explicit prior written permission of Fusion Media and/or the data provider. All intellectual property rights are reserved by the providers and/or the exchange providing the data contained in this website.
Fusion Media may be compensated by the advertisers that appear on the website, based on your interaction with the advertisements or advertisers.
© 2007-2024 - Fusion Media Limited. All Rights Reserved.