- Traders anticipate further gains today as optimism persists.
- Any potential pullback in S&P 500 and Nasdaq could present buying opportunities.
- The indexes remain within reach of new highs, driven by strong bullish sentiment.
- Looking for actionable trade ideas to navigate the current market volatility? Unlock access to InvestingPro’s AI-selected stock winners for under $9 a month!
With optimism still driving the markets, both the S&P 500 and Nasdaq are flirting with record highs. The former has already set new all-time highs of late, while the latter is just shy of its breakthrough.
At the time of writing, US futures are firmly in the green, indicating a positive start to the last trading session of the week.
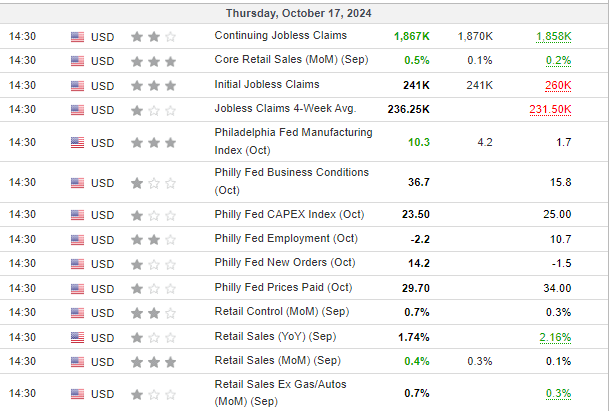
Yesterday, strong retail sales and steady unemployment claims data from Thursday reinforced the bullish sentiment that’s been in place since early this month, leaving traders wondering if the upward momentum will continue.

S&P 500: Bulls in Full Control
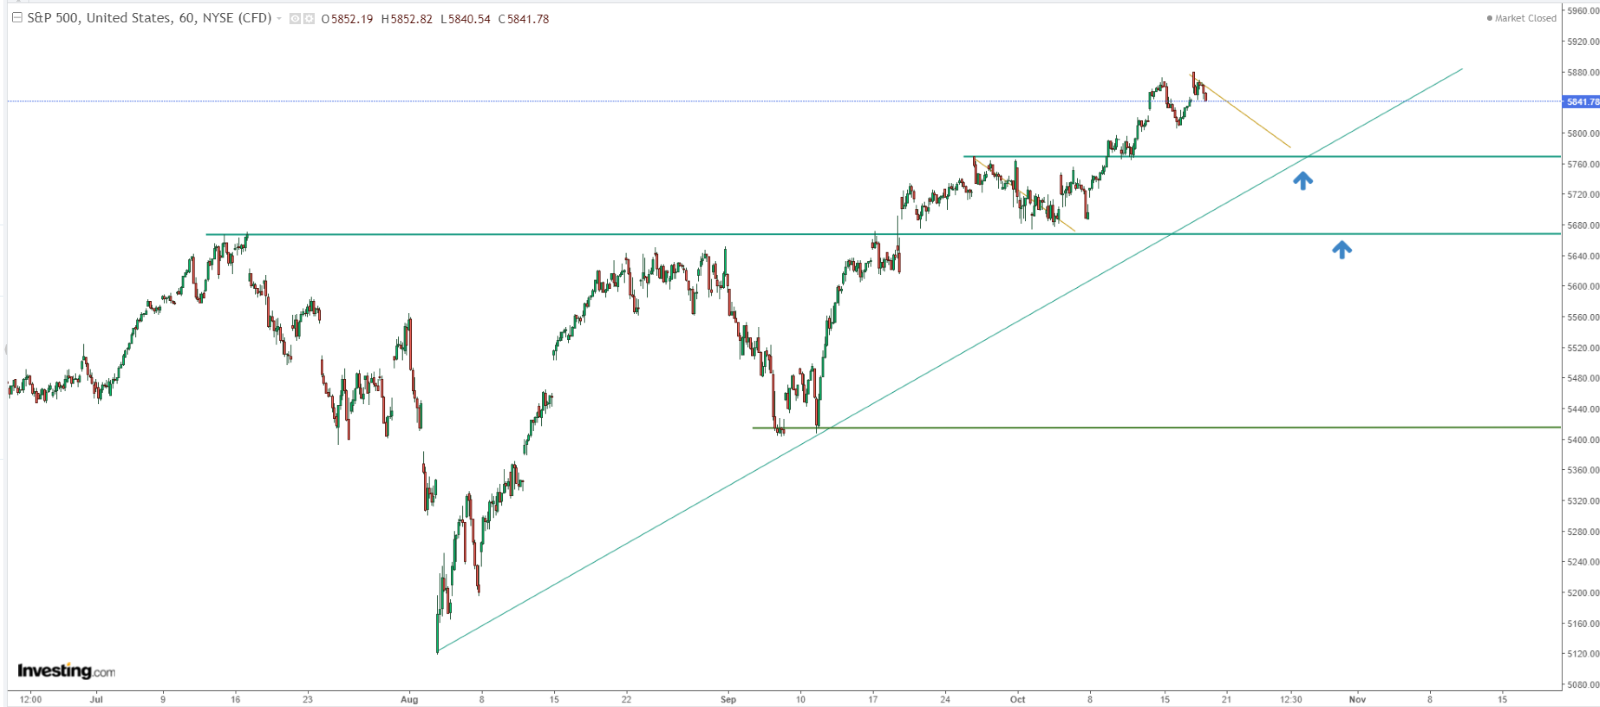
The S&P 500 has been largely immune to any significant downward correction for over a month. While growth has slowed to a brief consolidation, sellers haven't been able to push the index lower.

The next key resistance stands just below 5,900, and unless market sentiment shifts, this level could easily be breached. A dip to the 5,770 support area may provide an entry point for traders looking to join the rally as it continues its climb.
In both indices, the bulls are firmly in charge, but technical signals suggest traders should stay alert for potential pullbacks that may offer strategic buying opportunities.
Buyers Stalling Before Nasdaq's Next Big Move?
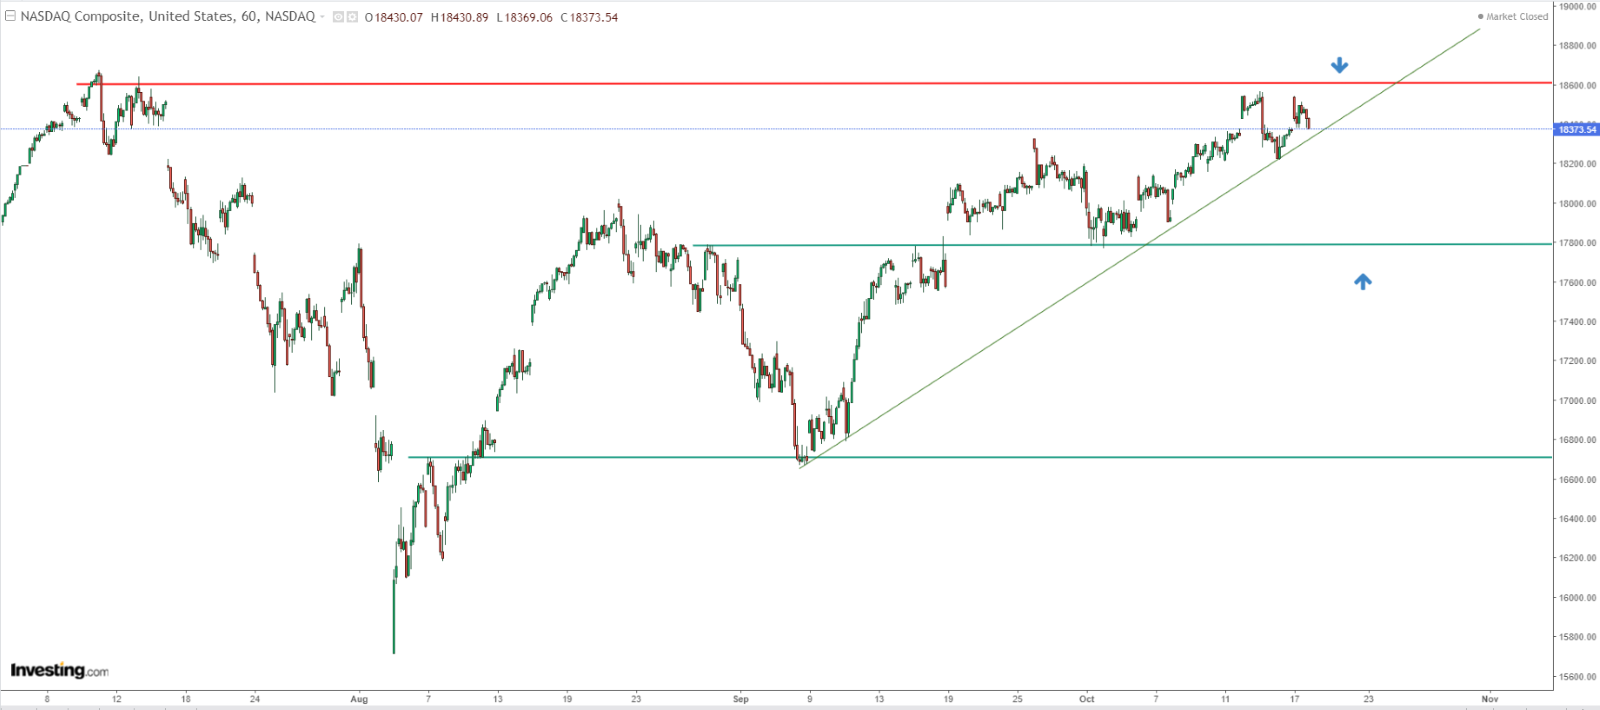
Last week’s analysis pointed to the possibility of new highs for the Nasdaq, and the outlook remains the same. Although the index hasn't quite hit its target, growth is still the dominant theme.

However, if the accelerated uptrend line is broken, traders could see a brief pullback. A retest of the 17,800 support level may offer a chance to buy at a better price before the Nasdaq aims for the 19,000 level.
DAX Bulls Eye the 20,000 Mark with Growing Confidence
The German DAX has maintained its upward momentum, driven by investor confidence even as the European Central Bank's recent interest rate decision came in as expected, leaving market dynamics largely unchanged.
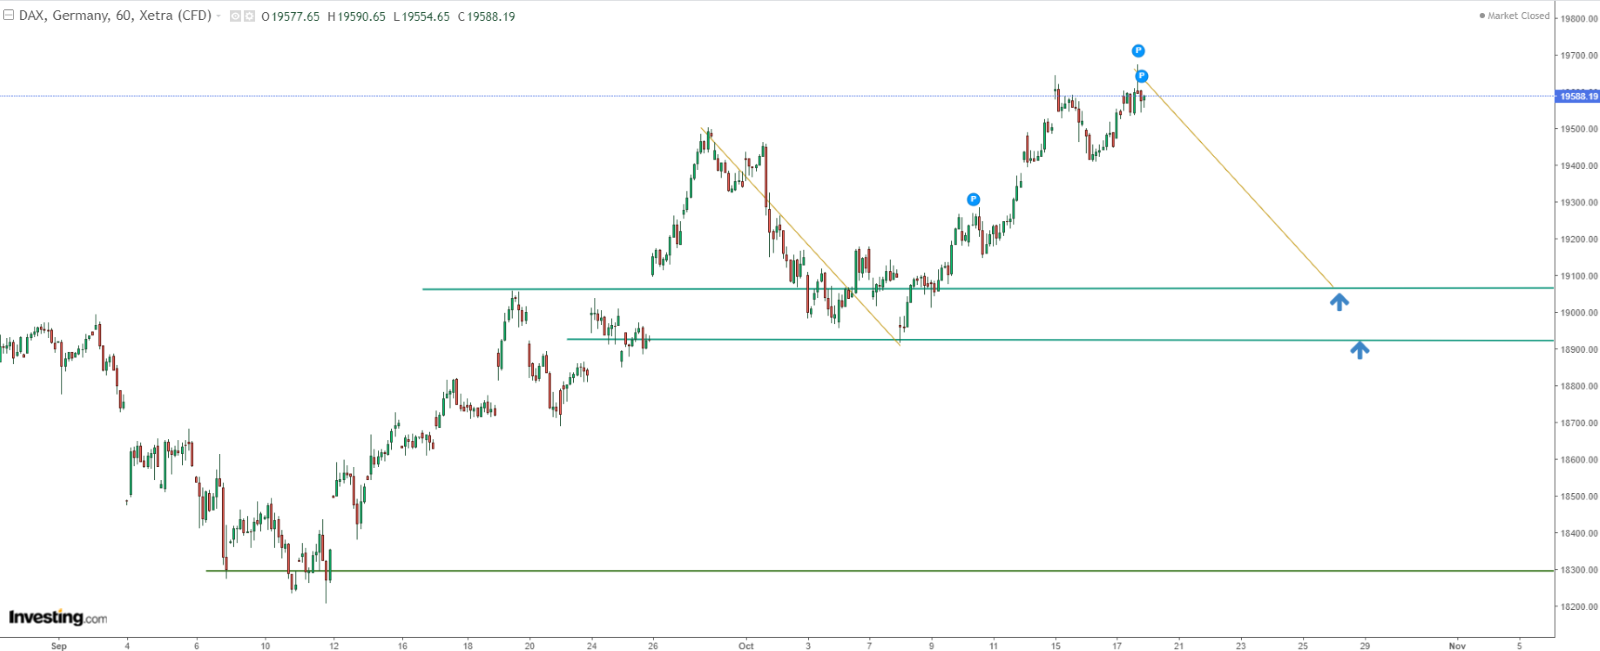
The bulls have successfully kept the index above the 19,500 mark, with their sights set on the psychologically significant 20,000-point barrier as the next target.

In a scenario where the DAX experiences a short-term pullback, traders should focus on the support level around 19,000 points.
This area also aligns with the last major correction in the current uptrend, making it a critical point of interest for investors looking to capitalize on any dip.
As the DAX continues its journey upwards, keep an eye on these key levels and market signals to make informed trading decisions. The path to 20,000 points presents compelling opportunities for those ready to engage with the market’s momentum.
***
Disclaimer: This article is written for informational purposes only; it does not constitute a solicitation, offer, advice, counsel or recommendation to invest as such it is not intended to incentivize the purchase of assets in any way. I would like to remind you that any type of asset, is evaluated from multiple perspectives and is highly risky and therefore, any investment decision and the associated risk remains with the investor.
