Tuesday's big story was rising rates, and it isn’t just here in the US; it’s global. The US 10-Year rate rose 10.4 bps to close at 1.32%, while the German 10-Year rose by 8 bps to close at -35 bps, which sounds super low, but consider on Jan. 6 the German 10-year traded at -63 bps.
These rising rates are the biggest risk to the equity market, as I have been telling everyone for weeks. Today may not help with PPI due; estimates are for a 0.4% increase m/m and 0.9% y/y. A hotter reading surely could get things moving. Remember, the ISM manufacturing reported prices paid, reaching levels not seen since 2011.
The 10-year closed just below the 2016 lows of 1.34%, with the next major resistance level around 1.6%.
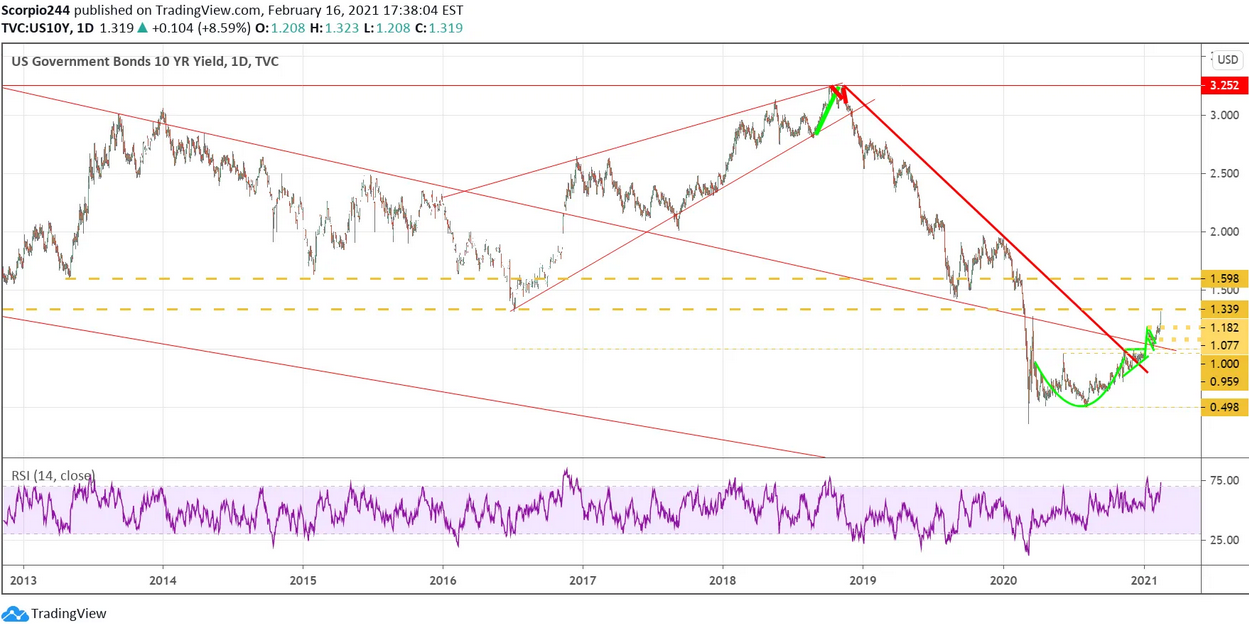
But the problem is that when a market is trading historical high levels on the thesis of low rates, as rates rise, the market becomes more and more expensive on a relative basis.
VIX
The VIX also moved back over 20 to finish at 21.5; so much for the falling VIX. Again, the VIX is likely at the bottom of the range between 20 and 22, and unless something changes to the structure of implied volatility across the market, the VIX isn’t likely to break down anytime soon.
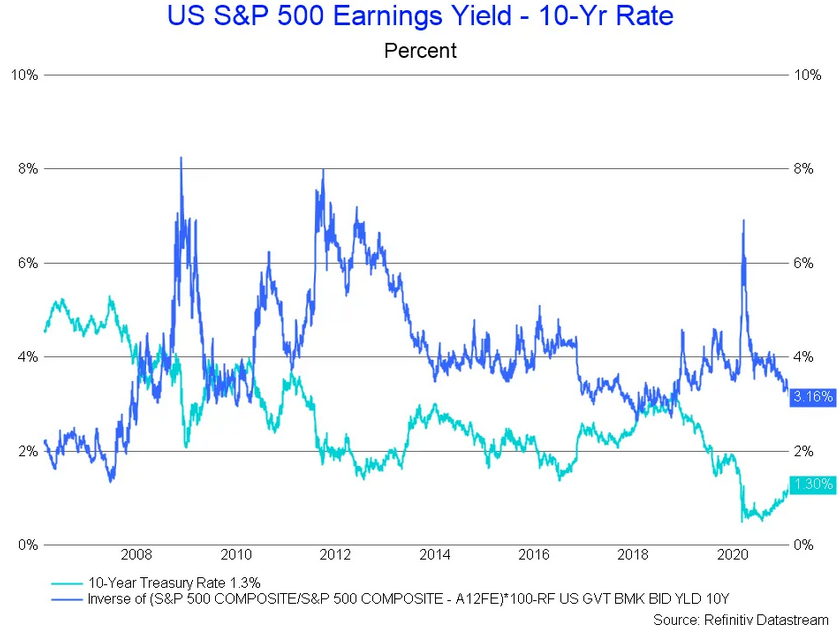
It takes us back to the risk that is building in the marketplace. Higher rates mean that if equity prices continue to rise, they will grow more expensive versus the 10-year at an alarming rate. Currently, the earnings yield of the S&P 500 trades at a 3.16% premium to the 10-year rate. It also leaves the index at levels versus the 10-year not seen since 2018. It is equivalent to the S&P 500 trading at a PE of 31.6.
S&P 500 (SPY)
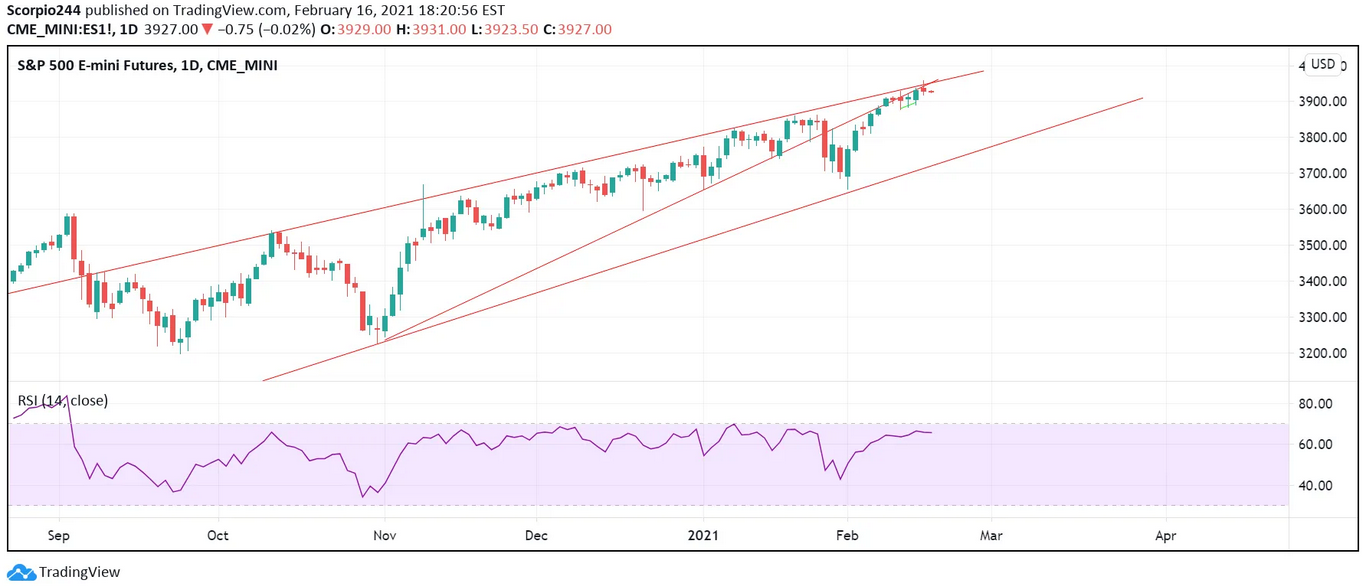
From a technical standpoint, the S&P 500 futures continue to struggle at resistance, which is the trend line.
It was a good thing the banks rose sharply yesterday, with the Financial Select Sector SPDR® Fund(NYSE:XLF) increasing by nearly 2% and the energy sector Energy Select Sector SPDR® Fund (NYSE:XLE) rising by nearly 3%. It isn’t likely that these sectors can continue to rise at this pace, and that means at some point, the S&P 500 will feel the pressure of rising rates.
10-Year Tip (TIP)
10-year TIPS also rose sharply yesterday, with the yield rising to -92 bps from -1.02% on Friday. Leaving breakeven inflation rates unchanged.
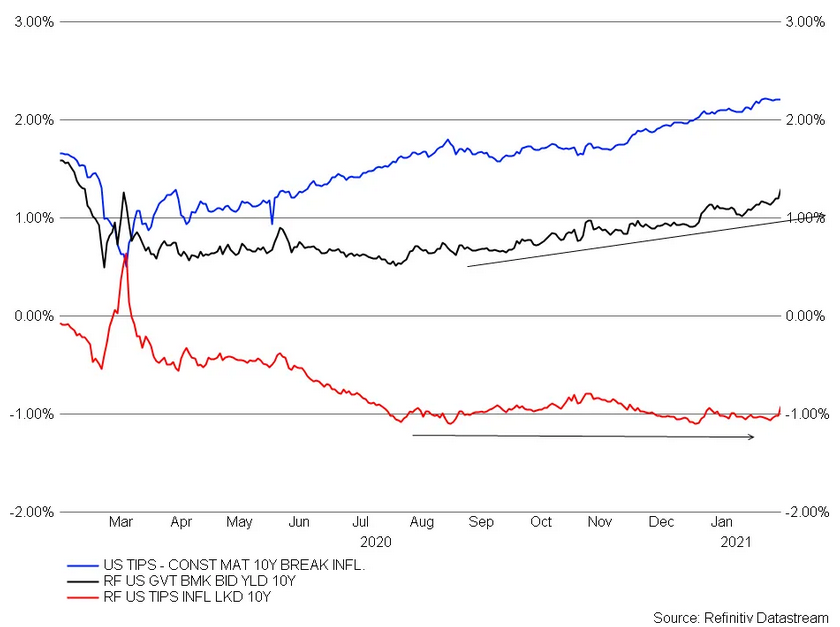
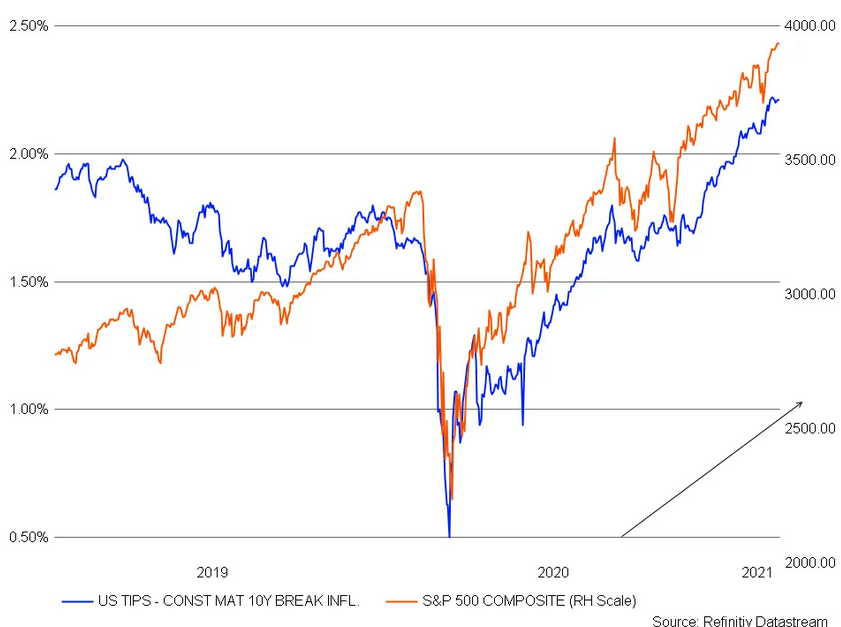
This is by far the most important spread to continue to watch because the 10-year breakeven inflation rate has been the most highly correlated spread tied to the equity market.
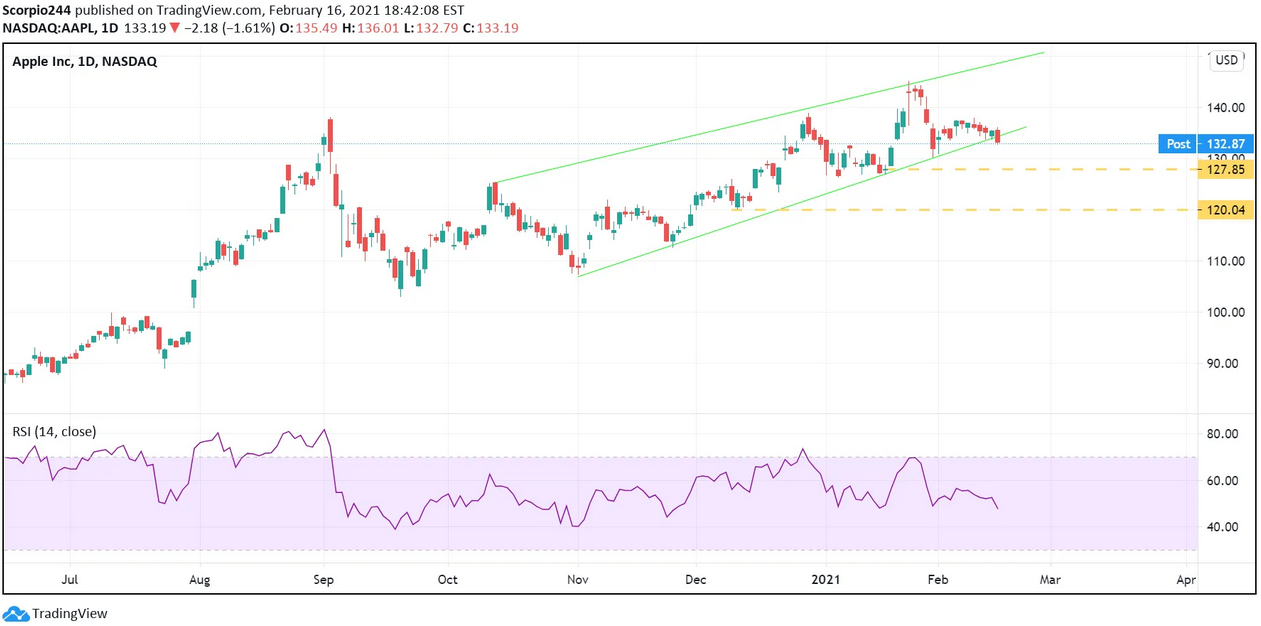
Apple
Apple (NASDAQ:AAPL) did not have a good day, closing below the uptrend and trading down to $133. Late last week, I noted a giant bearish option bet in Apple and that a break below the trend line was likely to set up a decline to around $127 but more likely $120.
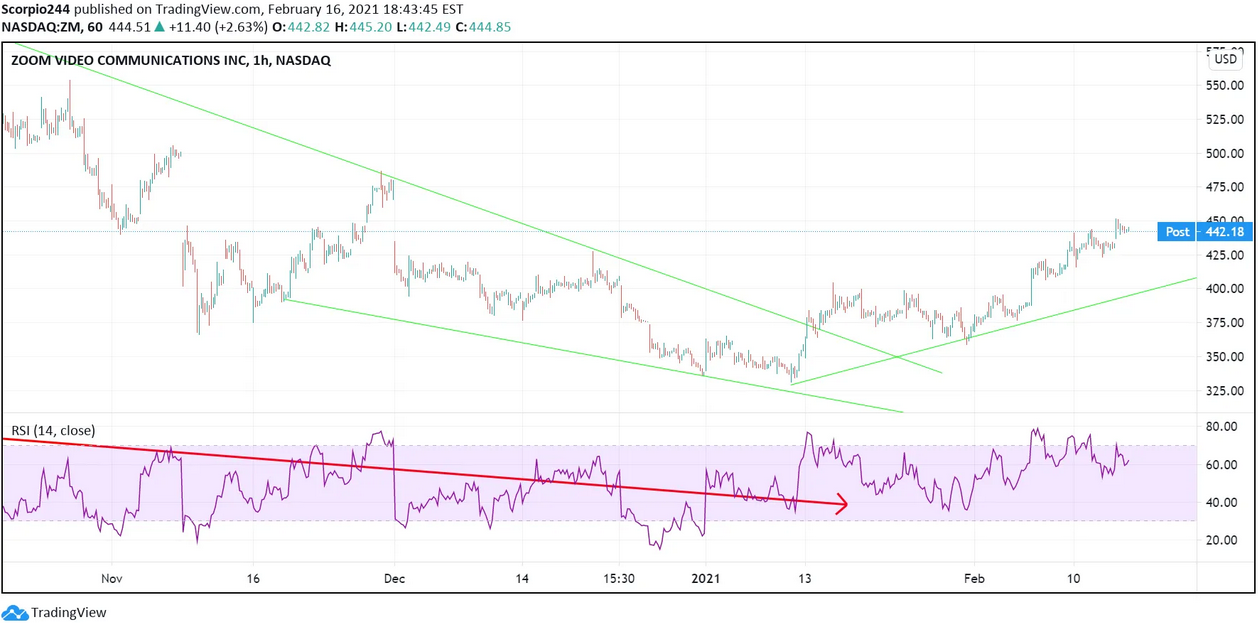
Zoom
Zoom Video (NASDAQ:ZM) is close to filling that gap, which means it likely rises to around $470. Once the gap is filled, I would expect the stock to turn lower and continue its trend down.
Boeing
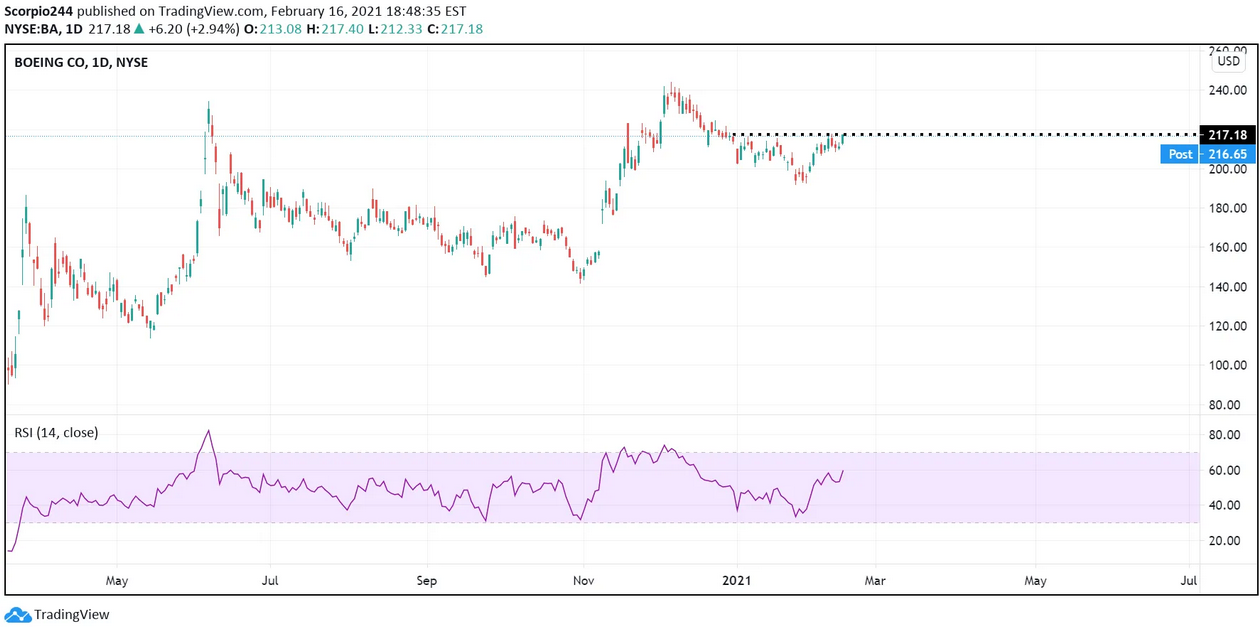
Boeing (NYSE:BA) is very close to moving above resistance at $218. If that can happen the stock has a meaningful chance to push higher to $240.
