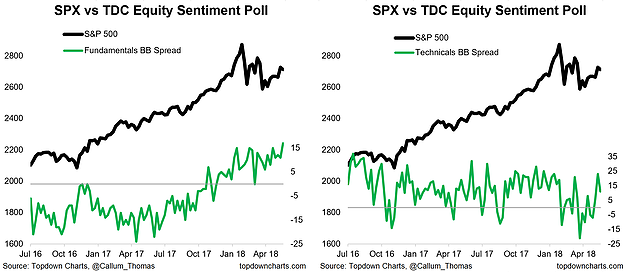
Looking at the charts this week investors remain bullish and judging by the margin debt and leverage charts, investors are clearly voting with their feet! This article reviews the latest results of the weekly survey I run on Twitter. The survey asks investors whether they are bullish or bearish for fundamental vs technical rationale and for both equities and bonds. This week we actually saw a record broken, with the highest reading on "Bullish (Fundamentals)" for equities since the survey began. As the sum of the charts below show, investors look to be very confident on the outlook for stocks.
The key takeaways from the weekly sentiment snapshot are:
- Equity investors are very bullish on the "fundamentals" outlook.
- Bond investors on the other hand remain bearish on the fundamentals.
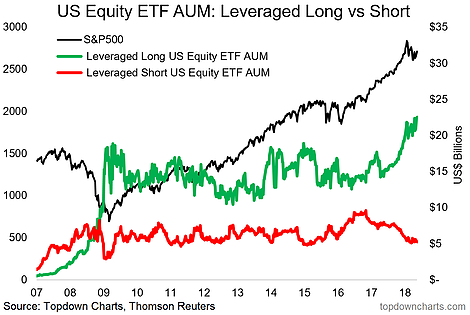
- Equity investors are backing this confidence with substantial bets in leveraged ETFs.
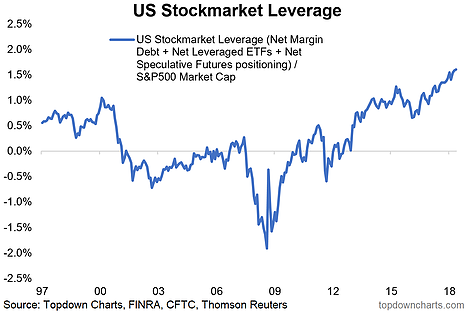
- For that matter, stock market leverage overall remains around record highs in absolute terms and as a percentage of market cap.
1. Fundamentals vs. Technicals Sentiment: Starting as usual with a look at fundamentals vs technicals sentiment for equities, the results were really interesting this week. The general uptrend in the fundamentals bull/bear spread culminated in an all-time high (now to be fair, the survey only commenced in July 2016, so take the words "all-time-high" with a grain of salt). But the bottom line is that investors still seem very optimistic on the fundamentals, although as I mentioned in the latest Weekly S&P 500 ChartStorm, there remains a degree of mixed signals and clear indecision in the market.
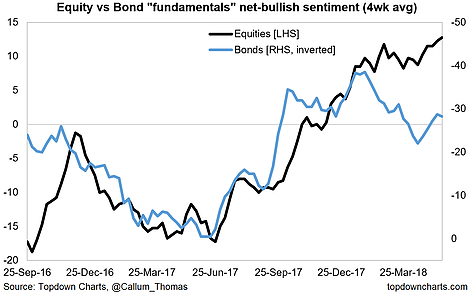
2. Equity vs. Bond Fundamentals Sentiment: Looking at the trends in bond market vs. equity market fundamentals sentiment, bond investors remain significantly bearish on the fundamentals for bonds (which is consistent with the bullishness displayed by equity investors on the fundamentals outlook). But I would say that the gap there represents some disparity in views or disagreement. Either way, it's clear equity investors are bulled up on the fundamentals.
3. Leveraged Long/Short ETF AUM: And if you wanted to see another expression of this bullishness you need only look at the Assets Under Management [AUM] for leveraged long ETFs. Last week it reached an all time high (and never really fell that much through the correction), meanwhile leveraged short ETF AUM is still around the bottom end of the range. So you can clearly see investors voting with their feet here.
4. Total US Stockmarket Leverage: Extending the view to a broader measure of stockmarket leverage (combined: margin debt, levered ETF AUM, and speculative futures positioning), you can see that as a percentage of market cap, total stockmarket leverage remains around all time highs. In dollar terms we're talking close to $400B in leverage - this shows how confident investors are in the outlook (especially the ones who tend to be smarter/well-resourced, due to the difficulty, cost, and consequence of obtaining leveraged exposure)... but naturally it also means the possibility of a selling cascade is very real should these guys need to unwind their positions with any degree of urgency.
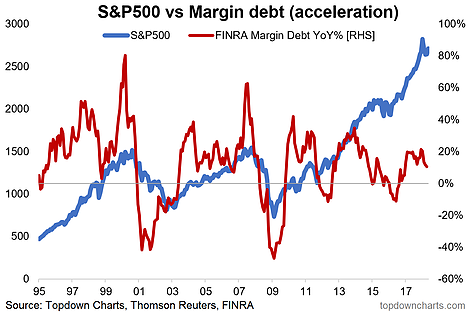
5. Margin Debt Acceleration: Final one is a look at margin debt acceleration - as I've explained previously, rather than the level of margin debt or the percent of market cap, I prefer to look at the rate of change as a timing signal. At the moment it has rolled over (data is latest to April), so it is somewhat cautionary, but it will only be giving a red light signal when/if it goes all the way to negative. One to be mindful of and stay on top of - and on that note, be sure to update your sources as NYSE has stopped publishing margin debt because FINRA has taken up this task with a broader view of the market, which is a positive step. So it's not "NYSE Margin Debt" anymore, it's "FINRA Margin Debt".
