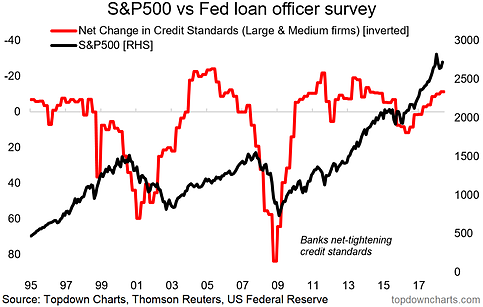
This week it's the Fed's bank loan officer survey and the S&P 500. The US Federal Reserves's loan officer survey provides insight into bank lending standards, and can give an important cross check against the markets. So much so, that you could easily call this chart the bear market warning indicator. And the bottom line is that it's still giving the green light for the S&P500.
The chart comes from a report on global lending standards and how loan officer surveys can provide an alternative source of insight into the economic outlook, activity levels, and financing conditions more broadly. Global lending standards is a key dataset that I look at and much of the findings line up with my constructive outlook on the global economy and risk assets.

Specifically on the chart, it's the net percentage of respondents reporting a tightening of standards for commercial and industrial loans to large and medium firms (from the Senior Loan Officer Opinion Survey). The line is displayed inverted on the chart such that the higher the line is on the chart the easier lending standards are.
This chart can be called a bear market warning indicator because when/if the red line turns down and below the zero point (above) it means banks are tightening lending standards. The reason that matters is because it both reflects a deterioration in economic conditions (business cash flow situation), but also drives a deterioration as credit becomes harder to obtain and marginal firms get driven to the wall.
We saw how it served as a useful early warning signal at the peak of the dot com boom, and in the lead up to the financial crisis. So this really is a key chart to have on your radar and it's one I come back to often. Again, as I mentioned at the start, it is currently in easy mode and giving a green light to markets.
