A year ago in May we published a “sell in May” portfolio that alternated between the Consumer Staples sector and the S&P 500. The concept was simple: Get defensive during a more volatile period, namely May–October. This year we want to share a similar hypothetical portfolio by building upon the previous idea and adding a new element: being contrarian.*
The Classic Approach
Contrarianism is a classic investment style that acts against predominant market trends. A rule of thumb of contrarian investing is “buy when others sell and sell when others buy.” Of course, the actual process requires much more complex analysis than just that. The hypothetical portfolio first implement the contrarian factor by going against the “sell in May” adage. Hence, the portfolio will stay invested in the S&P 500 from April 30 to October 31. In addition, while the “Halloween indicator” suggests that the S&P 500 generally performs well from October 31 to April 30, the hypothetical portfolio will go against the trend again by getting out of the broad index and playing defense during those months. In contrast to last year’s idea of using a single sector as a defensive play, this year the hypothetical portfolio will form the defense by equally weighting the Consumer Staples, Utilities, and Healthcare sectors. Thus, the contrarian portfolio will hold the S&P 500 Index from April 30 to October 31 and equally weight Consumer Staples, Utilities, and Healthcare from October 31 to April 30. The sample period runs from October 2000 through April 2016.**

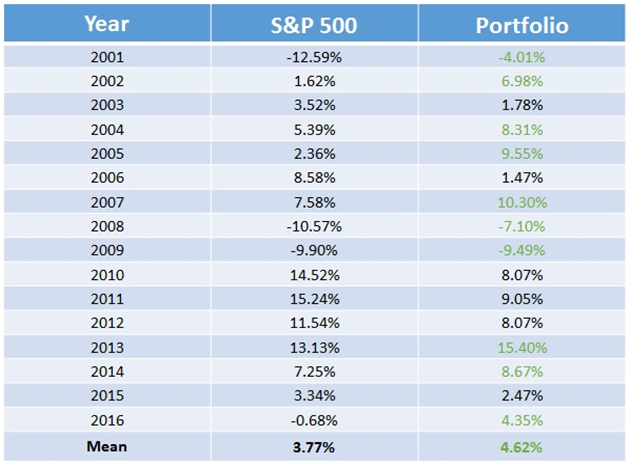
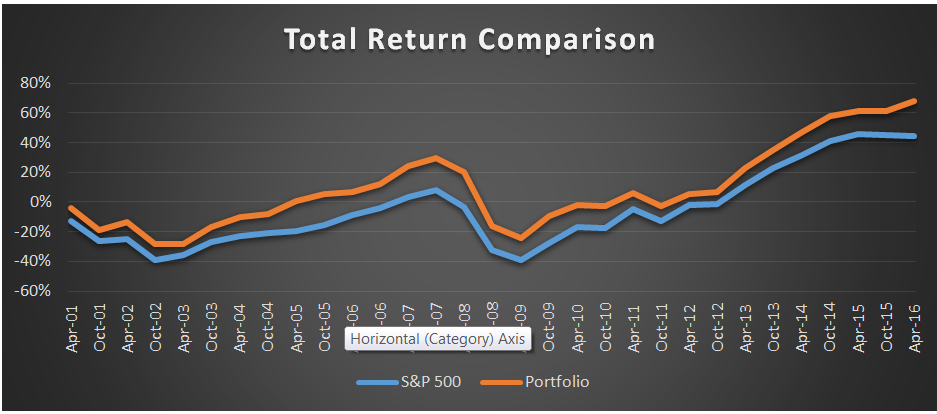
From Table 1 we can see that even though the hypothetical portfolio remains defensive from October 31 to April 30 each year, the holding-period performance turns out to be better than that of the S&P 500. The hypothetically equally weighted portfolio outperformed the broad market index 10 out of 16 years, with an average six-month return of 4.62% versus the S&P 500’s average return of 3.77%. Because of that 85 bps annual differential, the hypothetical portfolio outperforms the S&P 500 by roughly 22% in the 16-year sample period. As shown below in Figure 1, the portfolio’s total return is 68%, while that of the S&P 500 is 44%.

So how did such a simple portfolio outperform the S&P 500***? Investors often find that markets move in the opposite direction than most investors intuit. This fact contributes to the case for contrarian investing. Moreover, when investors spend large amounts of resources on finding bargains in the stock market, they often become oblivious to the best bargain right in front of their eyes: market sell-offs. While not every market dip is worth buying, with appropriate and sufficient research one may benefit from being a contrarian.
* As some readers may have already learned, Cumberland Advisors launched a contrarian strategy in December 2015. This is a purely quantitative model designed to capture opportunities occasioned by maximum fear in the stock market.
** We use ETFs for our experiment to mimic the actual performance our portfolio would have generated in the sample period. The results may differ should you replicate the portfolio with other resources such as Bloomberg. We begin our sample period from 2000 to align with the inception of sector ETFs.
*** S&P 500 price returns from Bloomberg.
