In finance, we call those abnormal returns that can’t be explained by known factors anomalies – they include things like the January effect, Days of the week effect (e.g. better returns on Friday than on Monday), etc. An anomaly defies the market efficiency hypothesis by persisting over time.
The very next anomaly that will fall upon investors’ calendars is the one immortalized by the phrase “Sell in May and go away.” But should we follow that pithy advice?
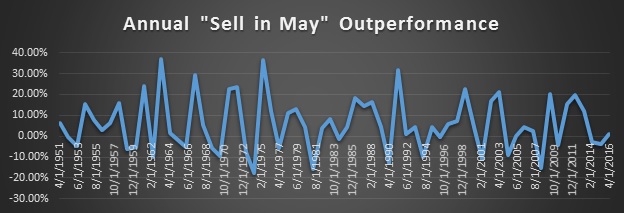
First, let’s take a close look at “Sell in May.” In order to compare time-series returns, we construct our experimental portfolio with a “Halloween indicator,” which keeps us invested in the S&P 500 from October 31 to April 30. The control portfolio is just the opposite – invested from April 30 to October 31. As shown in Figure 1, using data going back to 1950, on average the experimental portfolio (November–April) outperforms the control portfolio (May–October) by 5.64% annually.
This result is statistically significant at the 1% level, which means we can say with great confidence that the “Sell in May” portfolio should outperform the “Sell in November” one. Specifically, the average return from November to April is 6.99%, while the other six months’ yield is only 1.35%. Nevertheless, the realized standard deviations are fairly close: 10.09% for the experimental portfolio and 9.36% for the control. Summers traditionally see an uptick in volatility.

Now, should we just “go away” in May? The conventional wisdom is to avoid the unpredictable summer season, so we sell our equity holdings and park our cash in Treasuries. Although this strategy preserves capital, the total return is inevitably compromised.
On one hand, the equity market is becoming ever more volatile, and Treasury holdings seem to be a safe haven during such times. On the other hand, the evolving negative interest rate policy (NIRP) environment keeps eroding fixed-income returns. Therefore, we need a substitute that inherits less risk than the equity market but at the same time provides sufficient return.
Our attention falls upon consumer staples. The consumer staples sector possesses a beta of 0.62, which is low enough to make it defensive but not too low to catch upside return during uptrends. Especially during times of economic hardship, the price inelasticity within the consumer staples sector allows suppliers to maintain their profit margins, and thus ensures the sector’s relatively stable returns over volatile periods.
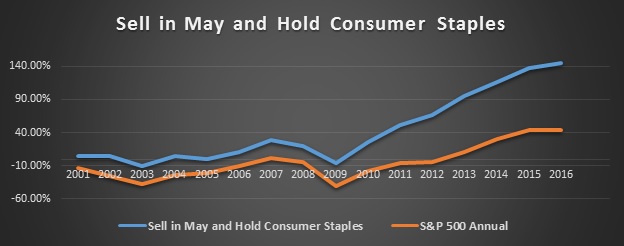
Overall, the consumer staples sector is the best performer among all sectors between May and October. To illustrate, let’s reconstruct our experiment portfolio by holding the S&P 500 from November to April and consumer staples from May through October. The total return of this alternating strategy since 2000 is now 145%, 101% above the S&P 500 in the same time frame (Figure 2 below).
The result has been even more pronounced in the past decade since the financial crisis. Moreover, the consumer staples sector’s risk-reward ratio is beating the S&P 500 by a significant amount, as demonstrated in Table 1 below.


Although the advantage of the alternating portfolio has increased in recent years, we need to keep in mind that past returns do not necessarily indicate future performance.
How long will this anomaly persist? As Wall Street likes to say, it works until it doesn’t.
