Summary: The "summer months" start next week. The period from May through October is known as the "worst 6 months" of the year for stocks. True, the probability of a truly bad month is higher and the probability of a really great stretch of months is lower during the summer than in the winter. But, overall, the expected return over the next 6 months is positive: median returns in winter and summer since 1970 are nearly the same. You might very well sell in May and buy back higher in November.
One of the axioms of Wall Street is 'sell in May and buy after Halloween'. Mark Hulbert says that over the past 50 years, the Dow has an average return of 7.5% from November through April ("winter") versus an average loss of 0.1% from May through October ("summer").
So, is the summer period that awful?
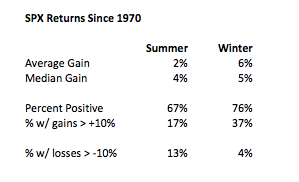
Using S&P 500 instead of the Dow, the data since 1970 still favors winter over summer: the average return is 6% in winter versus 2% in summer.
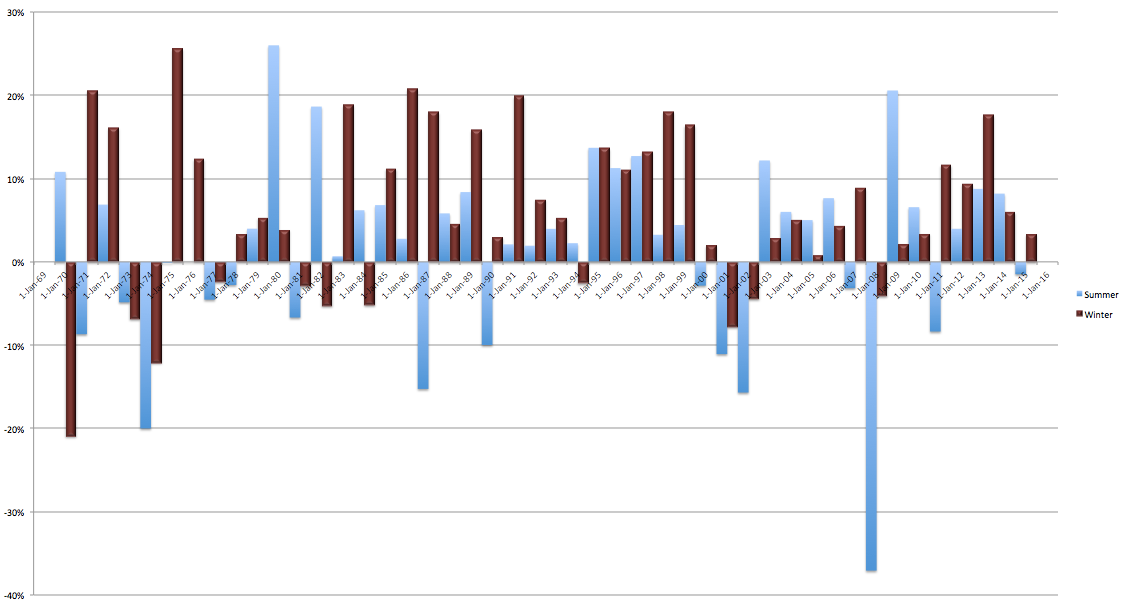
But this data is skewed by a few outliers; stocks fell 37% in the summer of 2008, by 20% in 1974 and 15% in 1987, to name a few.
Using median values, winter's return is 5% versus 4% in summer. That's a very small difference. The returns in summer are typically positive, meaning, you might very well sell in May and buy back higher in November.
Overall, 76% of winters since 1970 have been positive; fewer summers are positive (67%), but the difference is slight.
So why do investors fear the summer months? There are two reasons.
First: since 1970, 64% of the worst months (in which stocks fell 5% or more) occurred during the summer. A bad month is twice as likely during the summer as the winter.
Moreover, really bad seasons with losses of more than 10% occur more often in the summer: 13% of summers experience a "correction" versus only 4% of winters.
Second: great returns overwhelming take place in winter. 37% of winters produce a return of 10% or more. In comparison, only 17% of summers have produced a great return. A good stretch in the market is more than twice as likely during the winter as the summer.
Below are the S&P 500 returns by season since 1970. Overall, the percentage of negative summers (blue) and winters (red) is not that different. But there are two big differences between the seasons. First, the large returns tend to happen in the winter. Second, the big falls tend to happen in the summer.

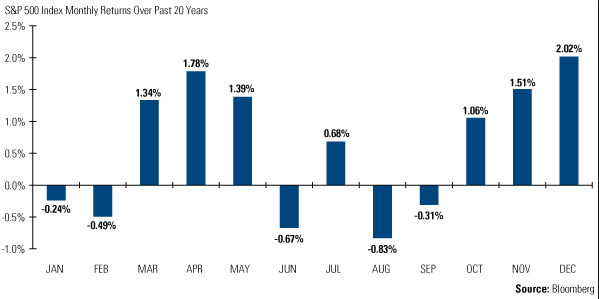
Below is the monthly performance of the S&P 500 over the past 20 years. June and August have been particularly weak while May is one of the best months of the year. July and October have also been good. Summer is less consistently weak than you might think (from Bloomberg).

In summary, the period from May through October is known as the "worst 6 months" of the year for stocks. True, the probability of a truly bad month is higher and the probability of a really great stretch of months is lower during the summer than in the winter. But, overall, the expected return over the next 6 months is positive: median returns in winter and summer since 1970 are nearly the same. You might very well sell in May and buy back higher in November.
