⭐ Start off 2025 with a powerful boost to your portfolio: January’s freshest AI-picked stocksUnlock stocks

S&P Breaks Out On Higher Volume Accumulation

Published 05/26/2017, 12:32 AM
Updated 07/09/2023, 06:31 AM
US500
-
DJI
-
US2000
-
IXIC
-

While I expected the Dow Jones to be the breakout flyer, instead it was the S&P which led the charge on higher volume accumulation. Technicals are all in the green with a return of the MACD trigger 'buy'.
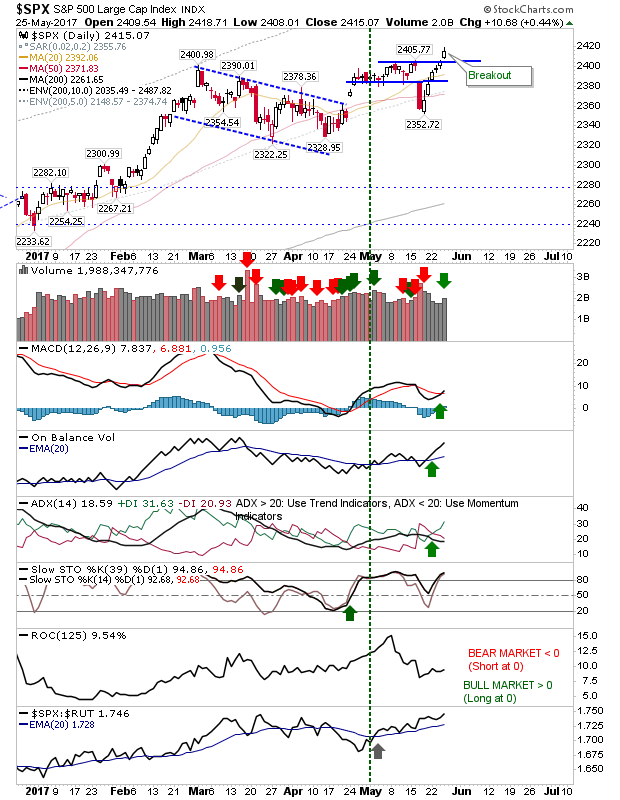
SPX Daily Chart

The Dow did manage to break past 21,000 with a MACD trigger 'buy' but it's still contained by all-time high resistance at 21,200. The index is still well positioned for a larger breakout, but this is the sixth day of consecutive gains for the index so some pullback can be expected.
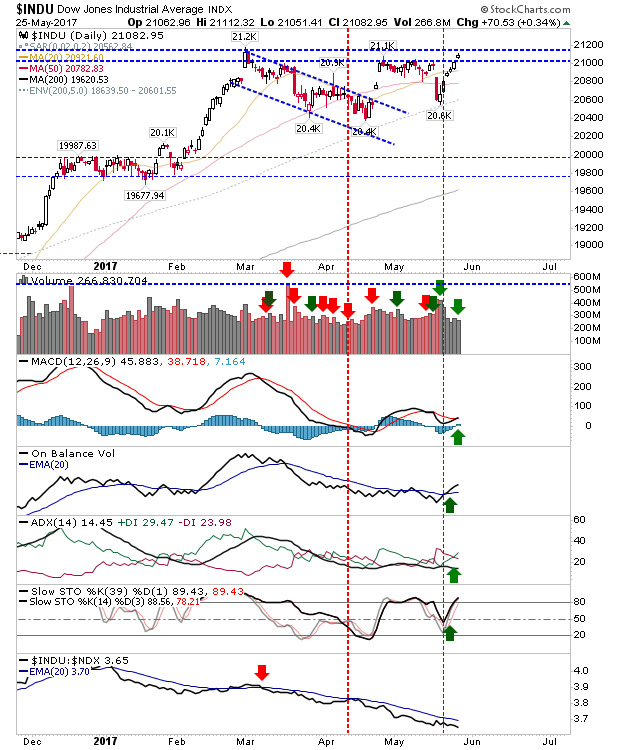
INDU Daily Chart


The NASDAQ posted the best gain of the day with a supporting MACD trigger 'buy' above the bullish zero line. Remaining technicals are firmly bullish. Momentum players have most to gain here with shorts out on a limb (at best).
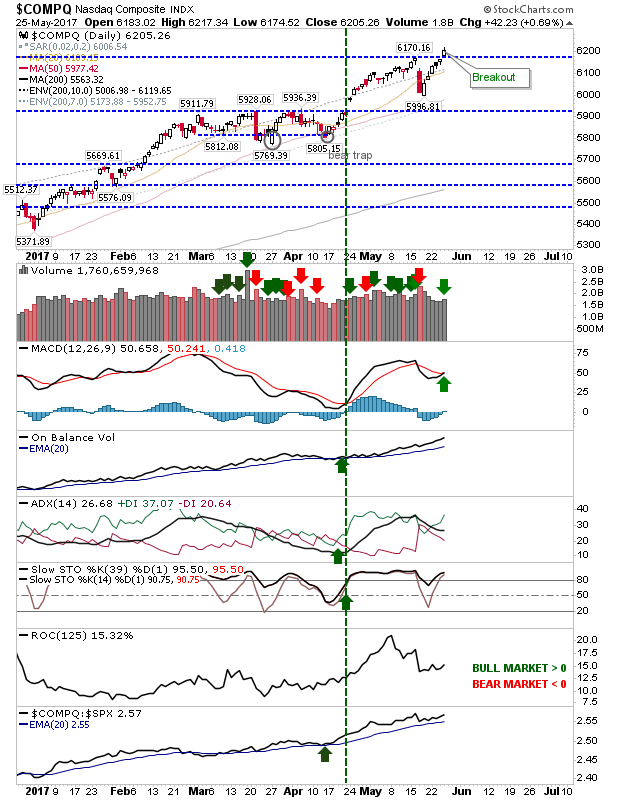
COMPQ Daily Chart


The Russell 2000 started to struggle on Thursday. While other indices enjoyed classic gains, the Russell 2000 experienced an indecisive 'spinning' top. Resistance remains in play and this could still be a factor on Friday.
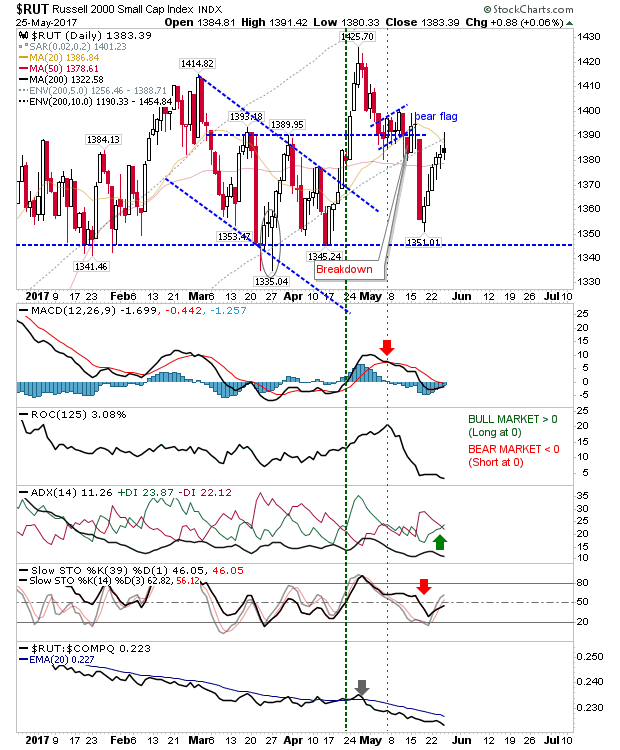
RUT Daily Chart


For Friday, bulls should be looking for pullback opportunities in the NASDAQ and S&P, or a push to new highs in the Dow Jones Index. Shorts may find some joy in the Russell 2000 as the relief rally begins to struggle.

Latest comments

Loading next article…
Risk Disclosure: Trading in financial instruments and/or cryptocurrencies involves high risks including the risk of losing some, or all, of your investment amount, and may not be suitable for all investors. Prices of cryptocurrencies are extremely volatile and may be affected by external factors such as financial, regulatory or political events. Trading on margin increases the financial risks.
Before deciding to trade in financial instrument or cryptocurrencies you should be fully informed of the risks and costs associated with trading the financial markets, carefully consider your investment objectives, level of experience, and risk appetite, and seek professional advice where needed.
Fusion Media would like to remind you that the data contained in this website is not necessarily real-time nor accurate. The data and prices on the website are not necessarily provided by any market or exchange, but may be provided by market makers, and so prices may not be accurate and may differ from the actual price at any given market, meaning prices are indicative and not appropriate for trading purposes. Fusion Media and any provider of the data contained in this website will not accept liability for any loss or damage as a result of your trading, or your reliance on the information contained within this website.
It is prohibited to use, store, reproduce, display, modify, transmit or distribute the data contained in this website without the explicit prior written permission of Fusion Media and/or the data provider. All intellectual property rights are reserved by the providers and/or the exchange providing the data contained in this website.
Fusion Media may be compensated by the advertisers that appear on the website, based on your interaction with the advertisements or advertisers.
© 2007-2025 - Fusion Media Limited. All Rights Reserved.