We are almost half way through 2016 and I have to say, it has been an interesting year so far. I’m sure you would agree.
In my opinion, the major theme isn’t the Chinese economic slowdown and potential for more RMB devaluation, even though a lot of folks would argue for it. I also believe it isn’t the Federal Reserve’s next interest rate hike, which just about everyone is obsessed with (especially the financial media).
Nor is it the US election and the potential Trump vs Clinton battle. European readers might advocate for “Brexit”.
Personally, I believe it’s something the financial media hasn’t started to focus on yet. The US stock market—which has dramatically outperformed other assets over the last few years—is not “the only game in town” anymore. Global macro investors (like me), are finally starting to gain in performance by holding assets other than the S&P 500, and it’s about time.
Let's discuss further.
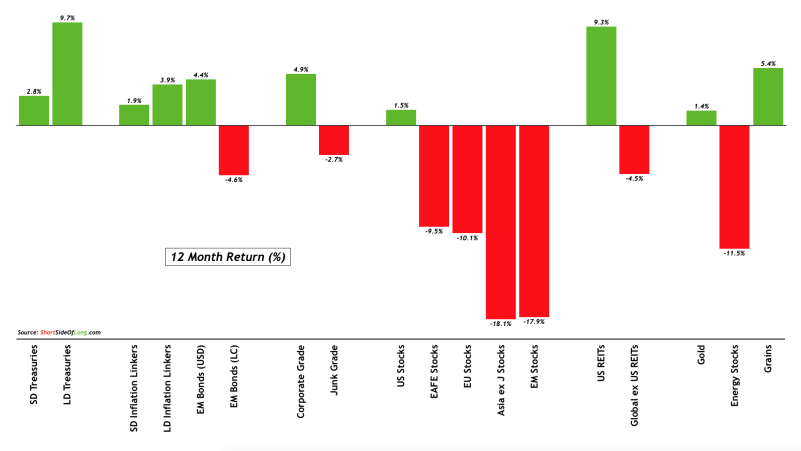
There are now a variety of assets outperforming the S&P 500 over the last 12 month time-frame (this is even more true on a 6-month rolling basis). These include nominal Treasury Bonds, Treasury Inflation Protected Securities (TIPS), Emerging Market Bonds (USD denominated), investment grade Corporate Bonds, listed US Commercial Real Estate (REITs) and the Grains Index (Soybeans, Corn and Wheat futures).
Even gold was doing so until the recent correction. We believe this trend will continue for a while and expect better returns for asset managers which aren’t overly exposed towards equities in the United States.
In recent newsletters, I discussed variety of opportunities on both the long and short side, including:
- The upcoming bottom in the Chinese mainland equities;
- A longer term opportunity that exists in the forgotten Vietnamese stock market;
- A surprisingly stubborn underweight equities exposure by global fund managers despite a strong rally since Feb lows (I like Asian equities in this space);
- Extremely high sentiment on Treasuries just before the Fed nears its second hike;
- Current correction in gold and gold mining shares;
- extremely depressed performance of raw materials (CRB Index) over the last 5 years;
- And finally, one of my favourite trades for 2016: potential for strong upside in the Grains Index due to expected La Nina.
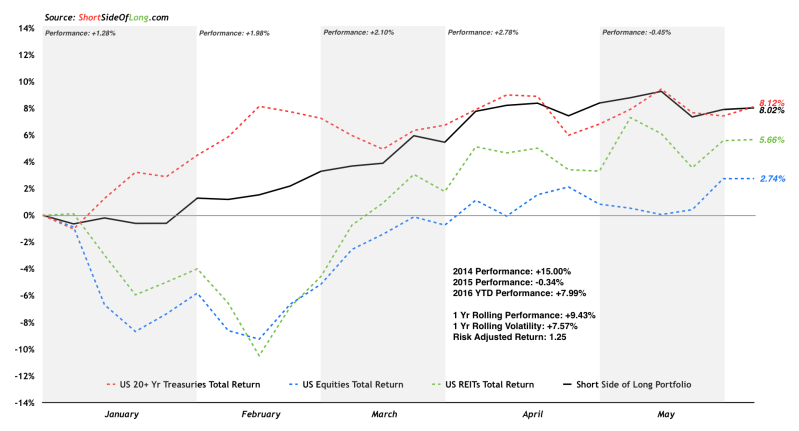
Year to date, my normal portfolio has managed to achieve 8% gain, with the month of May being my first down month (there is also a more aggressive version, but that’s a story for another day). So far, I have matched the Treasury Long Bond performance (iShares 20+ Year Treasury Bond (NYSE:TLT)), while outperforming US Equities and publicly listed Real Estate Trusts.
This return was achieved by holding a diversified portfolio spread across global assets such as: equities, bonds, real estate, precious metals, commodities and cash (relative currency positions). Moreover, if we measure apples-to-apples and observe the 12 month returns (similar to the first chart), my fund is up 9.4% with standard deviation risk of 7.6%. I am happy to say that we have outperformed the S&P 500 by some 800 basis points and more importantly with only 46% of the S&P’s volatility.
Let me now switch gears from investing toward the global economy, where there is a growing evidence that not all is well.
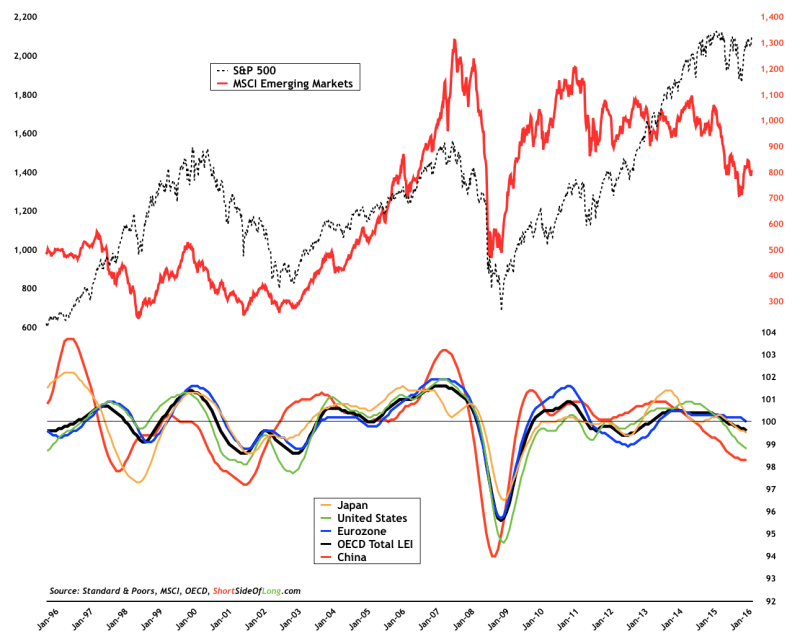
In a recent Bloomberg article, the Organisation for Economic Cooperation and Development (OECD) warned policy makers that, “the global economy is slipping into a self-fulfilling ‘low-growth trap'”. Recent OECD LEIs, seen in the chart above, have been sending a warning signal that growth is now below trend and slowing in all major regions. From the Bloomberg article:
According to the Paris-based group, which advises its 34 member countries, too much of the burden of lifting growth has been left to central banks. After pushing interest rates below zero and pumping money into their economies through asset purchases, they are starting to see diminishing returns and their actions could even generate financial-market volatility.
“Overall a rather mediocre, a rather dismal outlook,” the OECD secretary-general, Angel Gurria, said in an interview with Bloomberg Television in Paris before the outlook was released. “Trade is growing at 2 to 3 percent; it should be growing at 7.”
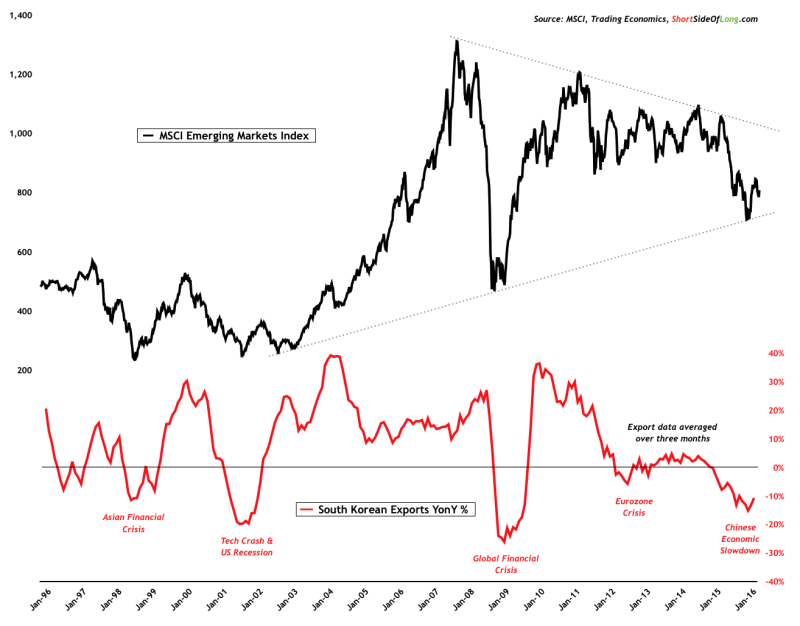
Global trade, which is so critical for healthy economic activity, definitely remains very slow according to recent South Korean export numbers. Regular readers already know that I closely track this data point, which I believe is a great barometer of the overall global economy (note: South Korean major exports include semiconductors, petrochemicals, machinery, automobiles, ships, steel, LCD and wireless communication devices), while major trading partners include China (25 percent of total exports), ASEAN (14 percent), the United States (10 percent) and the European Union (9 percent)).
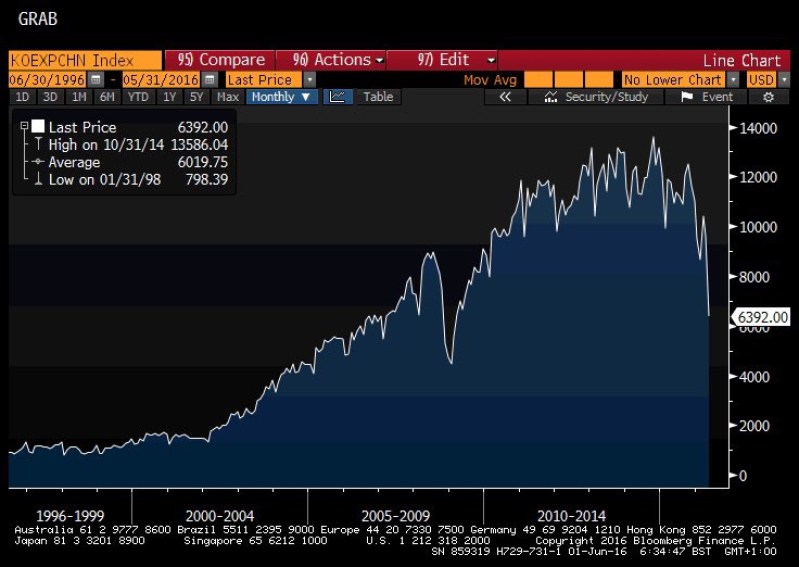
When I saw a huge drop in South Korean exports to China in the month of May, I was personally scratching my head and wondering if it was a data mistake. The truth is, global trade figures are not improving despite the fact that central banks continue to goose up financial markets with more and more monetary easing.
In Q1 of 2016, G20 trade figures slumped yet again. Furthermore, as my good friend in Hong Kong recently noted, container benchmark rates between LA and HK fell dramatically in 2015 and first half of 2016.
Moreover, Caterpillar (NYSE:CAT) sales to Asia have been posting contraction readings since December 2012. Obviously, a fall in global trade is closely correlated to the ongoing slowdown in manufacturing.
For the month of May, a JP Morgan Global PMI report stated that:
The global manufacturing sector maintained its lethargic start to 2016. Rates of expansion in production and new orders also eased to a near-stagnation, while the pace of contraction in new export business was one of the steepest during the past three years. The muted performance of manufacturing was also reflected in the labour market, as staffing levels fell for the fourth straight month.
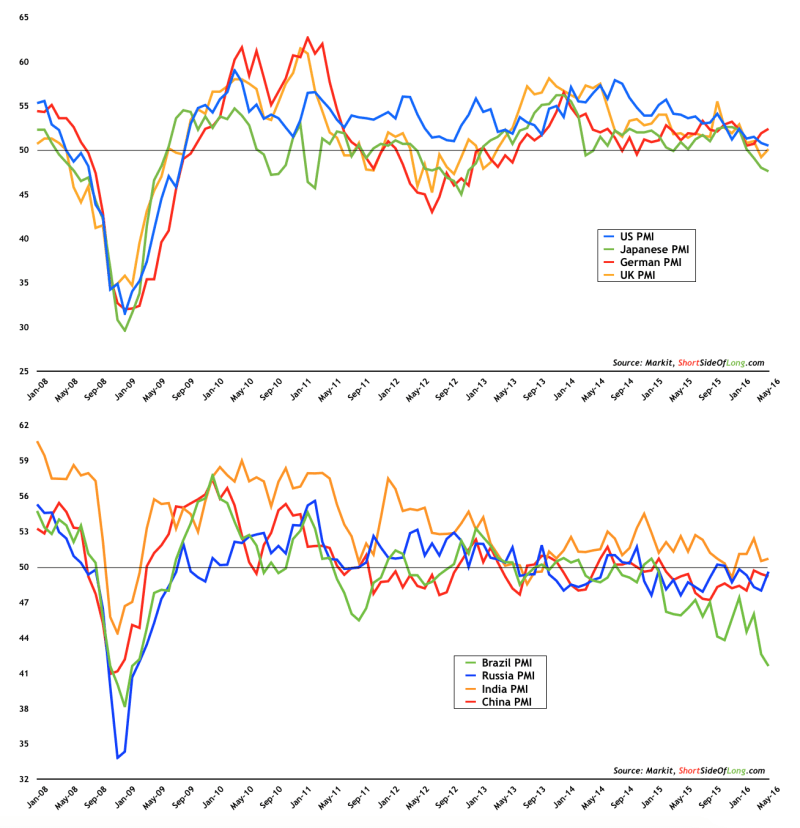
Breaking it down by region, the JP Morgan report had a narrative skewed towards anaemic growth in North America and Europe, with a continued slowdown in Asia and South America (chart above):
Although the US PMI remained above the 50.0 no-change mark, its rate of expansion eased to its lowest since the (Markit) survey began in October 2009. The euro area PMI slid to a three-month low in May, but nonetheless remained above the global average for the fifteenth month running. The two largest Asian manufacturing economies – China and Japan – both contracted in May. The downturn in Russia eased closer to stabilisation. The Brazil PMI sank to its weakest level in over seven years, placing it at the bottom of the global rankings.
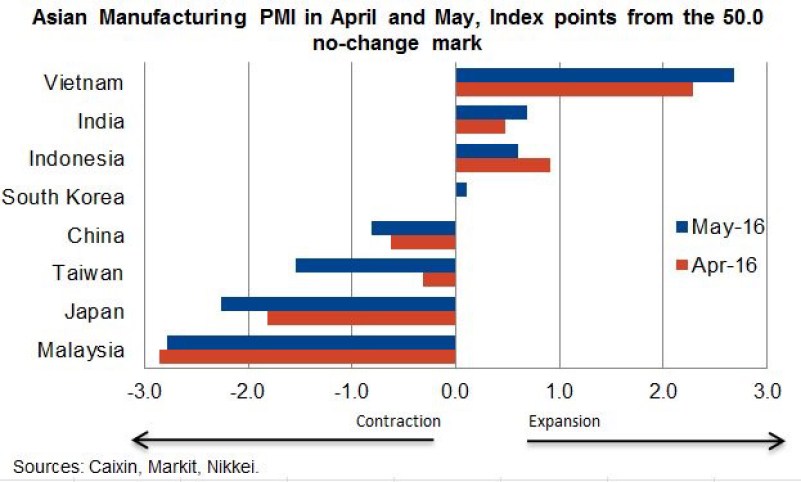
It is just as important to note that not all of Asia is struggling. I’ve been living in Vietnam for the last 6 months and Saigon is a boom town. The county's growth rate, manufacturing sector and export volumes remain one of the bright spots in the region.
It seems that we are experiencing a slow but steady relocation of factories from China to Vietnam. The TPP deal, (if it passes), should create further benefits for this rising economy.
The same cannot be said about the United States, where May’s regional surveys from Richmond to Philly showed a huge reversal in manufacturing sentiment. The rebound from Q1 was short-lived and more disappointments could be on the way, especially with so many uncertainties on the horizon, including the Fed’s next rate hike and the looming US election featuring undesirable candidates.
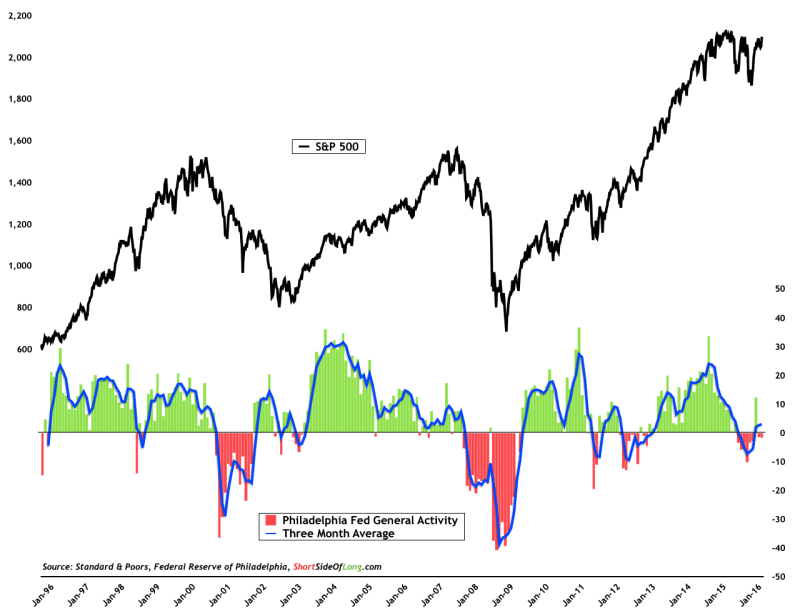
The Philly Fed General Activity Index is another indicator which makes it to my personal favourites list. In mid February, just as risk assets were bottoming out, I wrote:
“…the current [Philly Fed] conditions closely resembles the slowdown of the 1998 Asian Financial Crisis and my best guess is that the US economy is not in a recession just yet. However, I would like to add that without any notable recovery from here onward, we could very well be on the cusp of one.”
The three month moving average has jumped back above the zero line and the US economy still continues to muddle through (for now). However, the numbers are skewed towards only one positive monthly reading, during which both the ECB and BoJ were adding more stimulus while the Federal Reserve turned dovish and delayed the rate hike.
In general, recession risks continue to linger for the world’s largest economy.
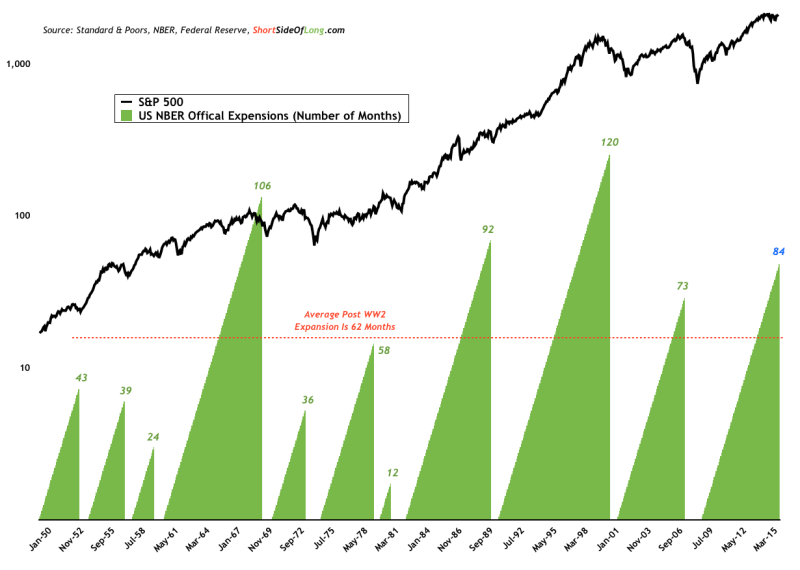
In June, the US expansion turns 84 months old (which is right on a seven year mark). This is now the fourth longest expansion since World War II. Average expansions generally last about 62 months with a median of 58 months.
Common sense would tell us that the longer the expansion runs, the closer we are to the next downturn. However, we don’t live in a common sense kind of a world anymore.
My belief is that Federal Reserve (and other central banking buddies) have made it their outright mandate, above inflation and employment data, to keep this expansion going for as long as possible. Eventually, markets will refuse to play the “easing” game and a financial shock could easily fabricate another meaningful slowdown in global economy.
With debt levels higher than they were in 2007, we should be asking ourselves if the next downturn might be worse than the one in 2008.
