Today we will focus on Merrill Lynch’s monthly survey of global fund managers, who oversee around $600 billion in AUM. The majority of the time, but not always, surveys such as these should be taken from the contrarian perspective and include some great insights as to how the consensus is positioned. As always, there are some pretty good charts and interesting observations, so let's get started.

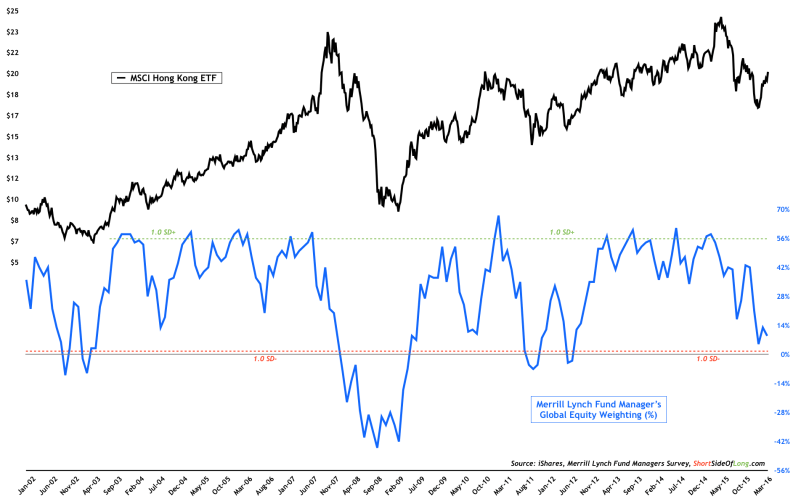
Equity allocations remain quite low, especially when one considers the recent multi-month powerful rally in global equities. Fund managers' allocations towards the stock market fell to 9% overweight this month, from 13% last month and 54% in April 2015 (just before equities rolled over). The chart above shows data for the iShares MSCI Hong Kong ETF (NYSE:EWH), which has been one of the most oversold markets since the Chinese rout began.
However, on our Twitter account readers can also see the same data for the MSCI Australia Index. We would assume equities have further to run based on this data alone, however we would advise caution on using only one indicator to make your financial decisions.

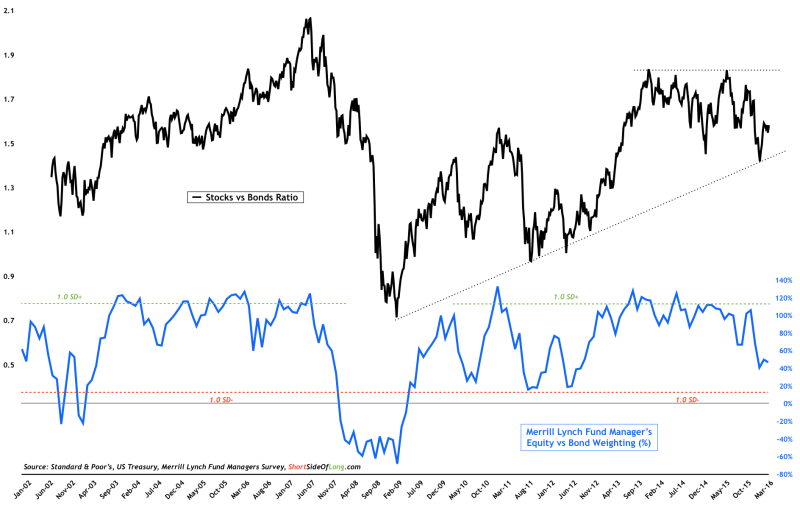
Bond allocations remained similar to the previous two months, as readings came in at 38% underweight. Worth noting however, fund managers were 64% underweight in December, just before the equity market sold off and the bond market rallied.
In the chart above, we have shown the difference in allocation of equities vs bonds, together with the ratio of stocks vs bonds. Globally, managers have been quite risk averse. While positioning towards the debt markets is not that extreme (allocations have risen to 20% underweight or even higher historically), there are other sentiment gauges arguing that Treasury yields could rise somewhat from here.

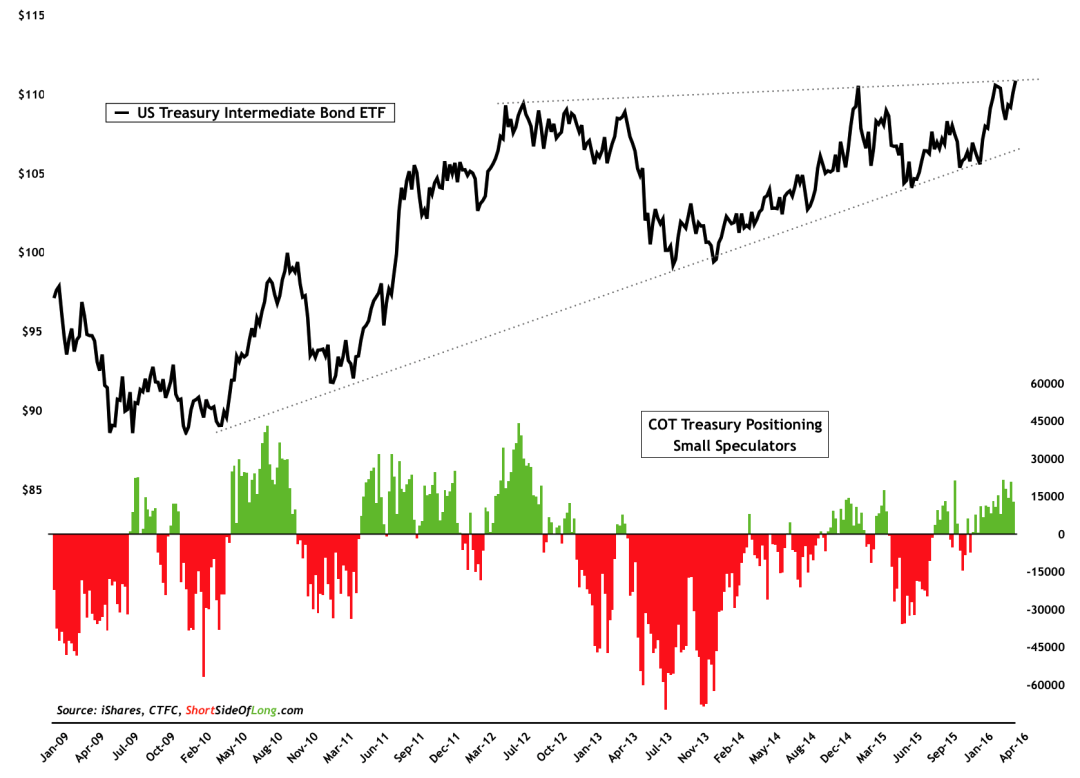
First, small speculators positioning in the futures market shows dumb money is chasing Treasuries with an expectation of lower yields. Second, Mark Hulbert’s Bond Newsletter Sentiment Index (click here to see the chart) shows record bullish recommendations by various advisors and newsletter writers. Third, number of shares outstanding on various Treasury ETFs have spiked in recent weeks (click here for the chart, thanks to Tom McClellan). Finally, according to ICI, fund inflows toward government bonds have been very elevated for weeks.
Putting it all together, one can see that there is room for unwinding of positions in the Treasury bond market. We have been long for a few months now and have recently changed our duration towards very short term Treasuries and Corporate grade bonds, as we expect a correction.
Having said that, Treasuries still remain attractive for three reasons:
- 1) Relative to the rest of the developed world, U.S. Treasuries look attractive and could be considered high yielding sovereigns with only Australia and New Zealand paying you more;
- 2) We still continue to favour assets priced in US dollars as we see the greenback resume its bull market once the current correction runs its course; and…

- 3) We think that longer duration Treasury yields could eventually break down from the technical consolidation patterns.

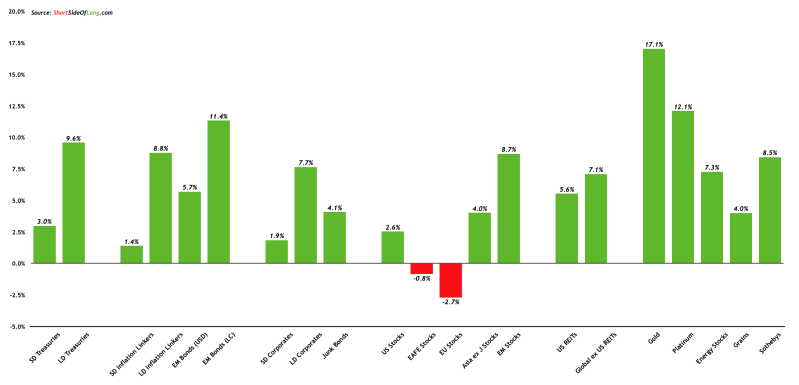
Finally, cash balance increased in the month of April to 5.4%, from 5.1% a month earlier. As already discussed above, despite a very strong multi-month stock market rally, fund managers continue to hold extremely high levels of cash. Risk averse behaviour resembles bear markets of 2000-02 and 2007-09. However, year-to-date performance of all major asset classes is pretty much positive (chart below).

Our take on high cash allocations by fund managers requires an investor to step away from day-to-day activities of the financial market, and focus on the longer term picture. We believe there is an overvaluation in all major asset classes, where global central bankers have goosed up and inflated the value of just about everything. We are very nervous and seem not to be the only ones with this view.
Bonds and cash are more expensive than they have ever been, with yields on Treasuries lower than at any other time in the last 220 years. Europe and Japan have gone into “la-la land” of negative interest rates, something that hasn’t happened in over 5,000 years of recorded history. Cash yields essentially zero or even negative in some countries. US stocks are the most expensive ever, apart from a few months during the dot com bubble, with some metrics showing future expected returns to be flat over the coming decade.
Basically, we have a situation where stocks, bonds and cash are expensive all at once. Depending on how events unfold, returns on all major asset classes could be very low or even negative (in tandem). No wonder global fund managers are frightened!
