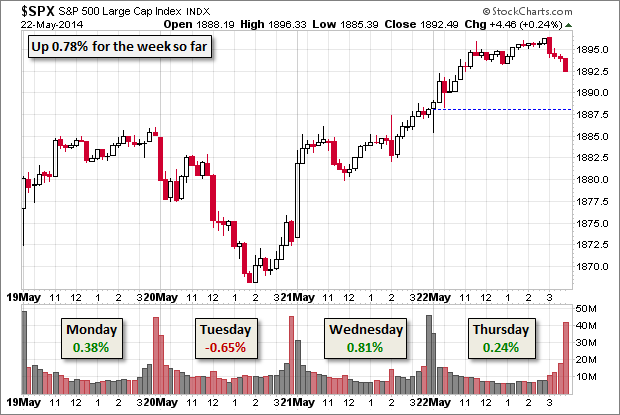
Before the US market opened, Japan's Nikkei posted a 2.11% advance while major European indexes were trading in the shallow red. The EURO STOXX 50) would subsequently close near the flatline, with a 0.02% gain. The latest new jobless claims was higher than forecast, but the S&P 500 (SPX) was little fazed by the disappointment. It stuttered at the open for about 10 minutes and then rose to its morning high two hours later. It then traded mostly sideways to its 0.44% intraday high at the start of the final hour. The index then steadily trimmed its advance to a 0.24% gain at the close.
Meanwhile, the yield on the 10-year note closed at 2.56%, up 2 bps from yesterday's close and 6 bps above the 2014 low.
Here is a snapshot of the week so far, which is up 0.78%.
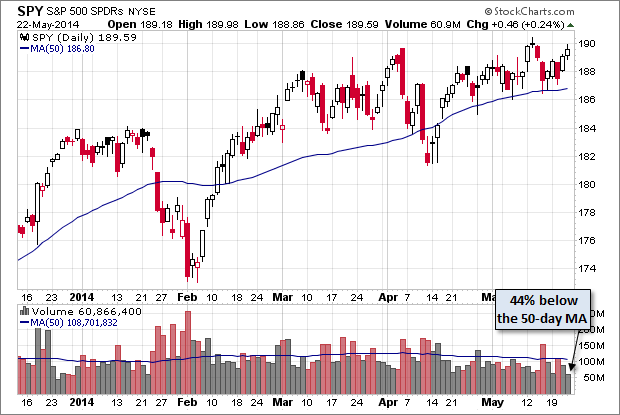
Here is a daily chart of the SPDR S&P 500 (ARCA:SPY) SPY ETF. Despite yesterday's advance, volume continues to suggest investor caution. Volume was the lowest since December 30th.
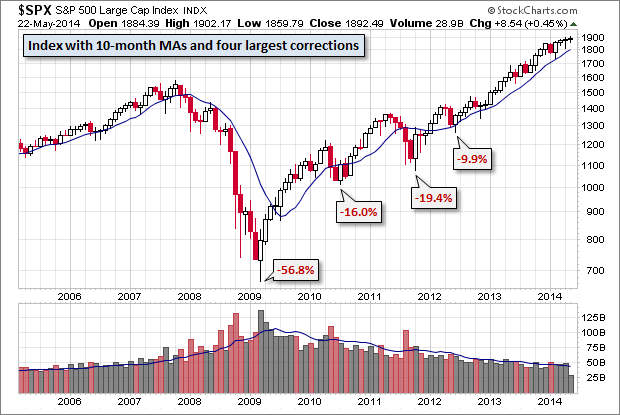
Here is a monthly chart on which I've highlighted the four index declines beginning with the Financial Crisis trough. It's been a while since we've seen anything even vaguely reminiscent of a correction.
Another Perspective on Drawdowns
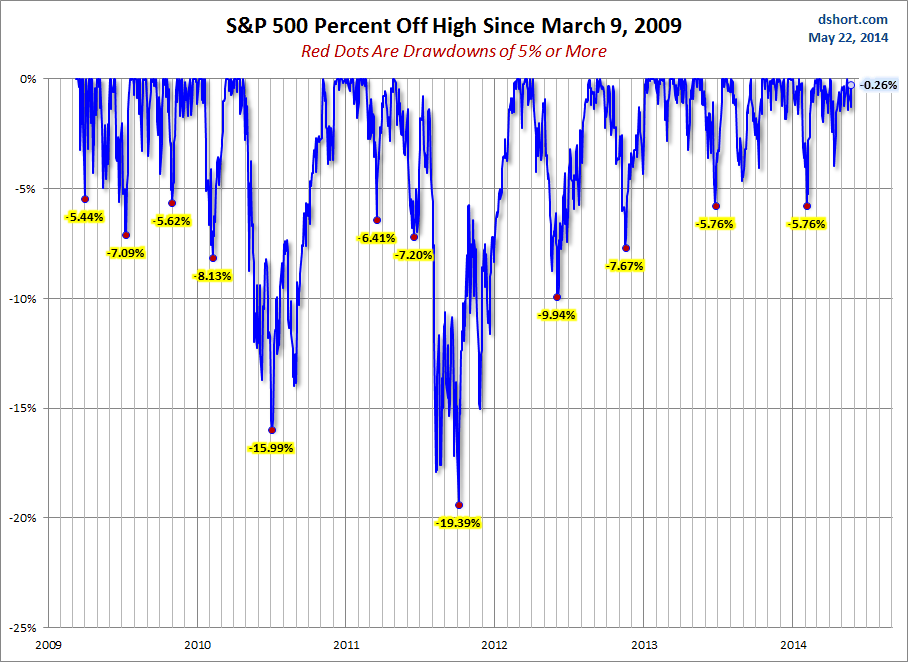
The chart below uses the percent-off-high strategy for illustrating the drawdowns greater than 5% since the trough in 2009.
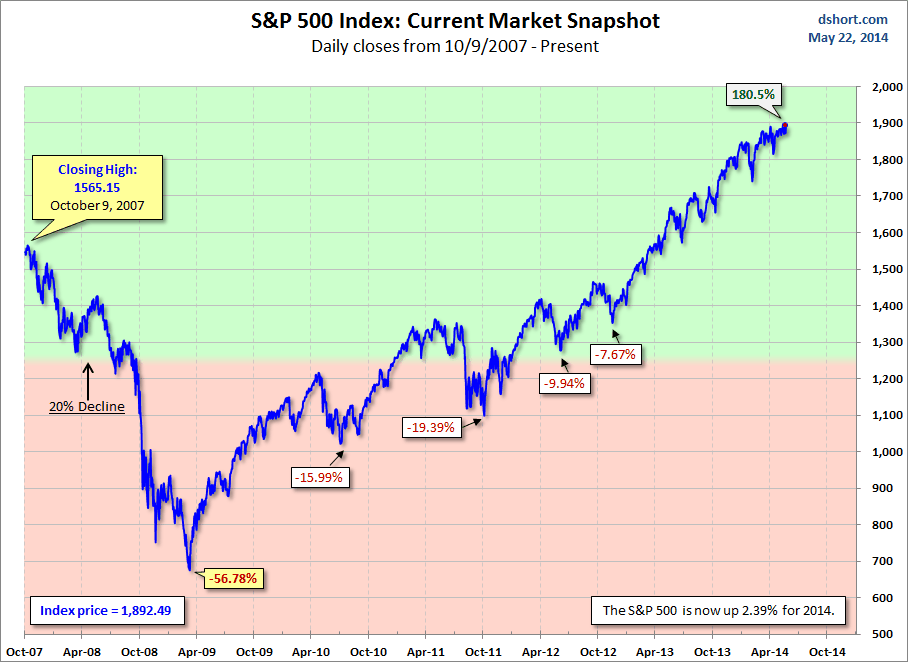
The S&P 500 is now up 2.39% for 2014.
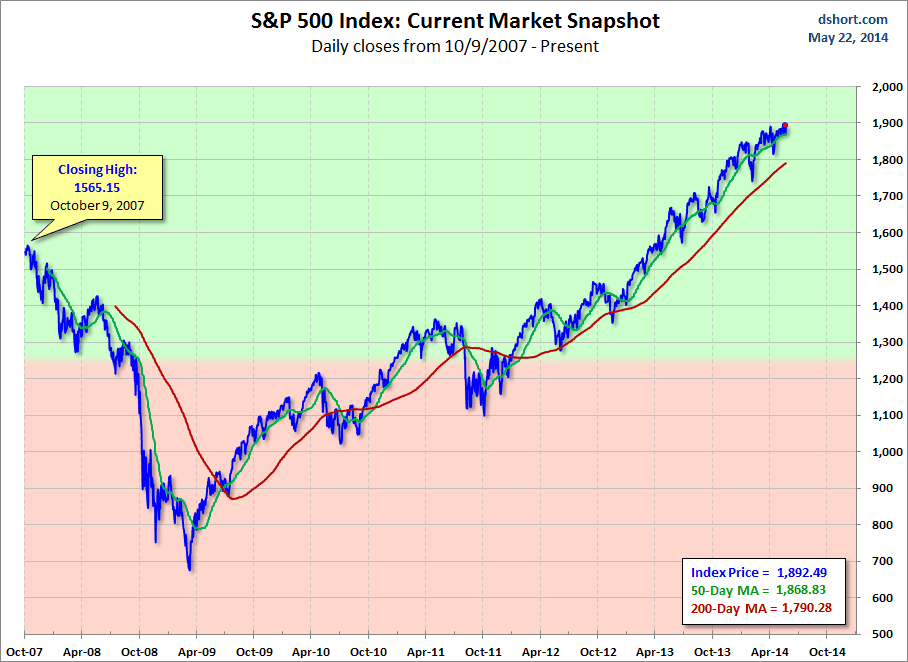
Here is a pair of charts based on daily closes starting with the all-time high prior to the Great Recession.

