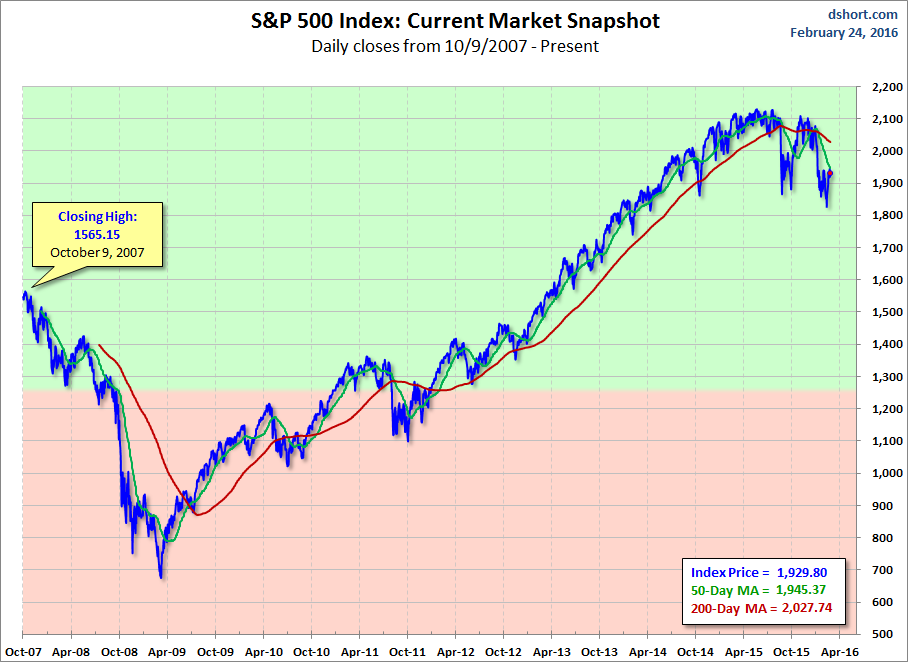
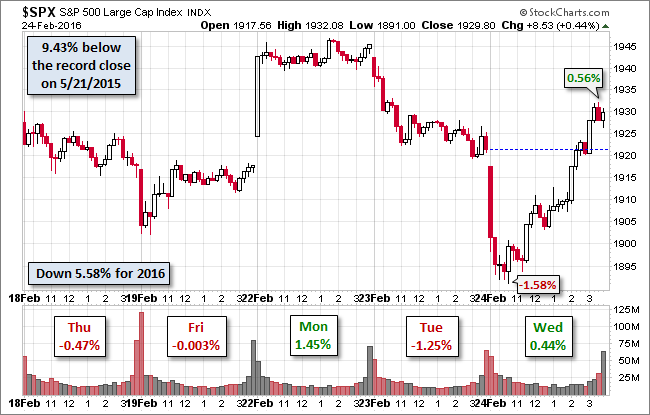
Our benchmark S&P 500 did a swan dive at the open, following the trend in Europe, where the Euro STOXX 50 would subsequently close with a 1.59% decline. But heading into the lunch hour, oil prices rose, and the US markets followed suit. The 500 rose from its -1.58% intraday low to its 0.56% late afternoon high about 30 minutes before posting its trimmed closing gain of 0.44%. Will the reversal pick up steam tomorrow? It will probably depend on what happens with crude futures.
The yield on the 10-year note closed at 1.75%, up one basis point from the previous close.
Here is a snapshot of past five sessions.
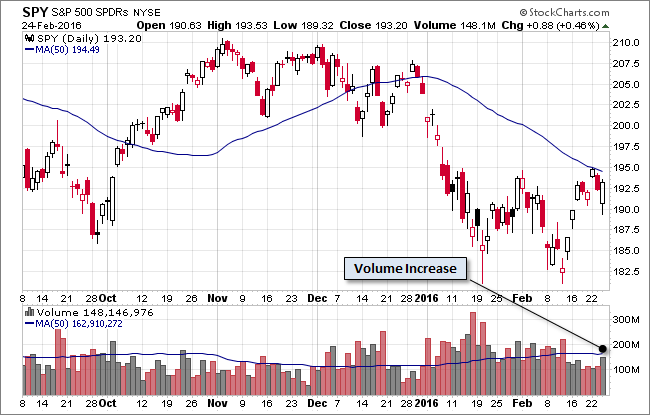
Here is a daily chart of the SPDR S&P 500 (N:SPY) ETF, which gives a better sense of investor participation than the underlying index. Volume picked up on today's reversal.
!
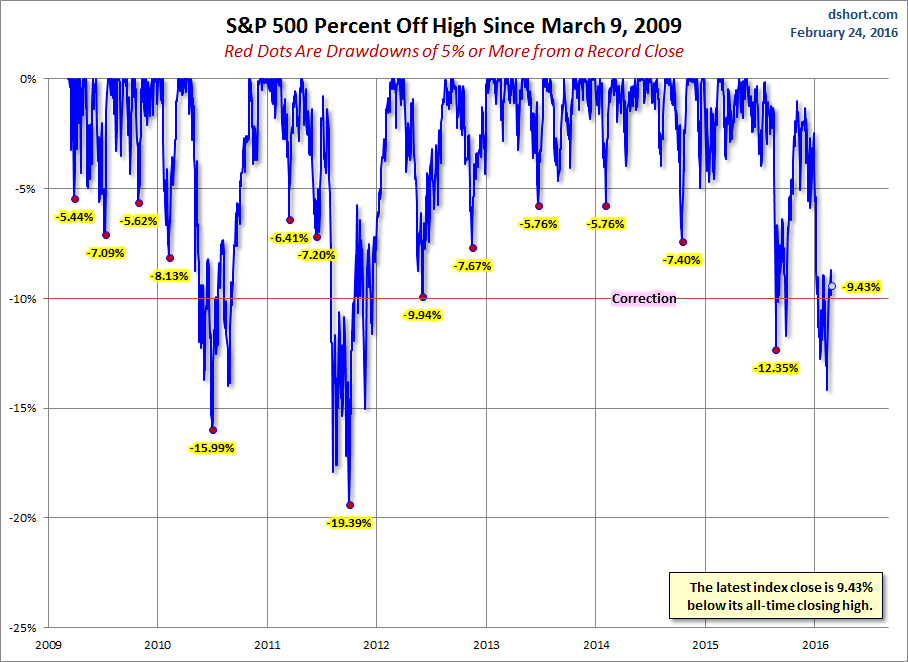
A Perspective on Drawdowns
Here's a snapshot of selloffs since the 2009 trough.
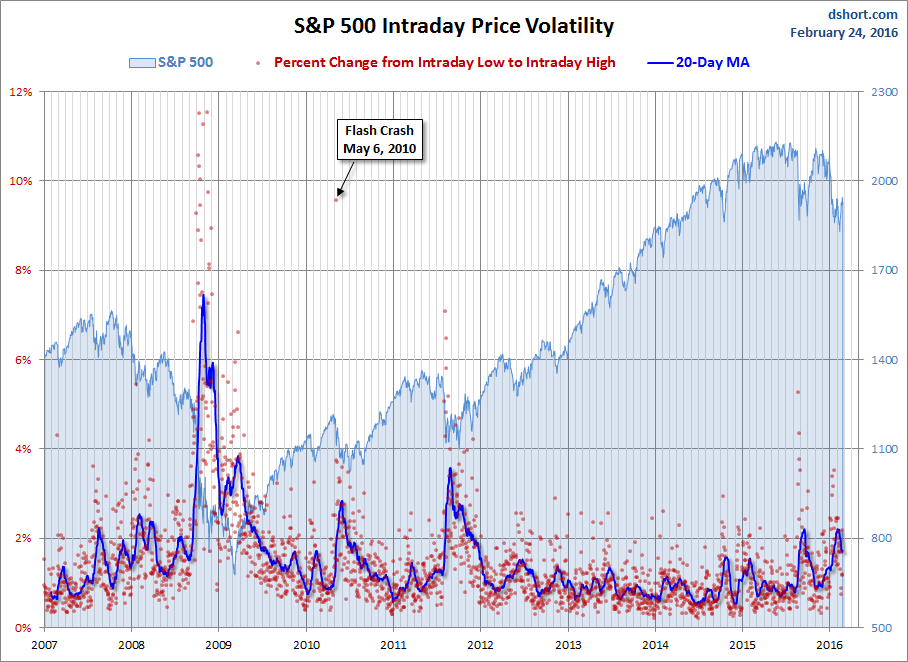
A Perspective on Volatility
For a sense of the correlation between the closing price and intraday volatility, the chart below overlays the S&P 500 since 2007 with the intraday price range. We've also included a 20-day moving average to help identify trends in volatility.
Here is the same chart with the 50- and 200-day moving averages.
