by Clement Thibault
This is Part II of our four-part series about how specific groups of stocks repaid investors in 2016.
Part I, Best Comeback Stocks Of 2016, was published right before the Christmas holiday. We borrowed our designations from the world of sports. Later this week we'll consider Rookies Of The Year: The 4 Most Successful IPOs Of The Year. Finally as the new year begins, we'll look at the stocks that most disappointed investors, the 'draft picks' that turned out to be a bust.
What a volatile year 2016 has been for the S&P 500. It started off catastrophically, with the index hitting 1810—a 52 week low—on February 11, thanks to the oil plunge. From there, however, the market took off, all the way to a new all-time high of 2277 just two weeks ago.
Overall, the S&P managed a 10.69% return year-to-date. That's quite surprising given all the uncertainty we've seen this past year, from the China market melt-down to Brexit through the US elections and most recently the Italian referendum.
But our MVPs definitely didn't disappoint, each surprising investors to the upside—and well above the benchmark index. Here are the top five S&P 500 stocks of 2016, based on closing prices as of Friday, December 23, 2016:
#5. Newmont Mining Corporation
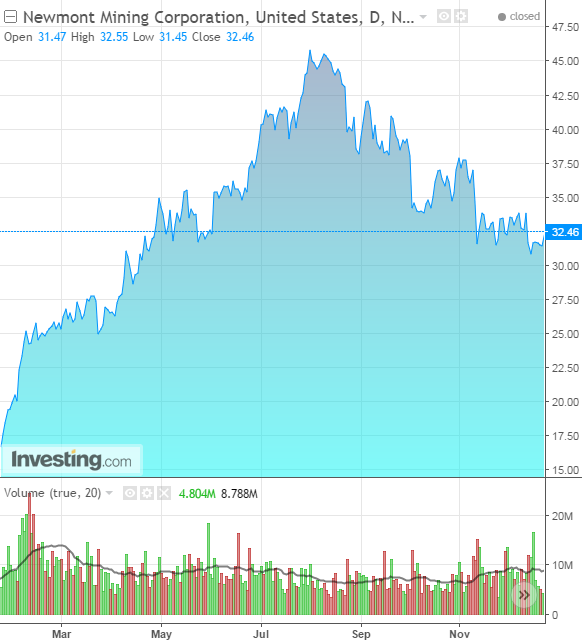
- Opening Price on January 4th: $18.44
- Closing Price on December 23rd: $32.46
- Gains: +$14.02, +76%
- Sector: Metal Mining
Newmont Mining (NYSE:NEM) is one of the world's largest gold producers, with 11 active mines in North and South America, Africa, and Australia. Like all companies in commodities-oriented sectors, the price of the stock is inextricably linked to the price of the commodity, in this case primarily gold and copper.
A number of risk events this past year—including crashing oil and unexpected election results—have generated market volatility which always leads to a rush for gold. As a company, Newmont has increased its gold production by about 3.3%, and now produces 1.25 million ounces a year. Unfortunately, the recent decline in gold's price has caused Newmont's stock to drop 29% from its high of $45.91 in late July, making it 'only' our 5th best performer of the year.
The year ahead: Within a notoriously risky industry, Newmont is one of the safer miners. The company's Debt-to-EBITDA ratio is 1.79 TTM, meaning the miner is not dangerously leveraged. Its all-in, sustaining cost of production for one ounce of gold is steadying, currently between $900 and $1050, meaning Newmont has successfully adjusted its cost of doing business to reflect the multi-year, down-trend in gold price since the beginning of the decade. We believe this means they should remain in the green going into 2017.
#4. Applied Materials, Inc.
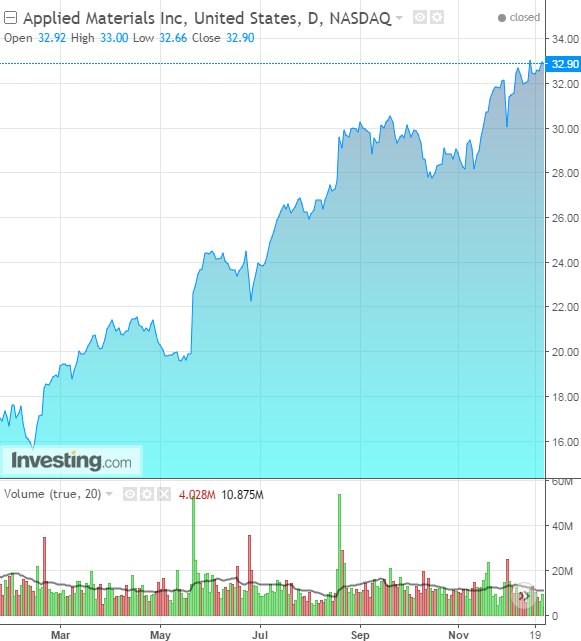
- Opening Price on January 4th: $18.31
- Price on December 23rd: $32.90
- Gains: +$14.59, +79%
- Sector: Semiconductors
Applied Materials (NASDAQ:AMAT), one of the world's leading materials engineering companies, has had a remarkable year of growth, leading to terrific performance for the company's shares during 2016. The company beat EPS expectations every quarter in 2016, and grew its revenue by 13.3% and 39.2% over the past two quarters, blowing past $3 billion in revenues, to $3.297 in fact, for the first time, just this last quarter.
Profit margins are also up, and gross profits grew by 45% last quarter. Orders grew 25% year-over-year, and backlog, or future orders, increased by 46%. AMAT's performance this year was boosted by strong demand for equipment the company makes for smartphone manufacturers including LG Electronics (KS:066570) and Samsung (OTC:SSNLF), most notably displays and memory chips, a trend that is expected to continue.
The year ahead: The expectation is that growth will slow in the coming two years since leading customers (such as smartphone makers) are reportedly cutting CapEx. At the same time, new OLED technology is cannibalizing LCD screens so there's little growth expected in displays. Nevertheless, AMAT is still the market leader. Its valuation, P/E 21, forward P/E 14, doesn't indicate the stock is overvalued. However, after a well-executed, $1.9 billion share buyback program in the past year, Applied Materials has brought the process to a complete stop. This could indicate that management believes the company is now fairly valued.
#3. Freeport-McMoran Copper & Gold, Inc.
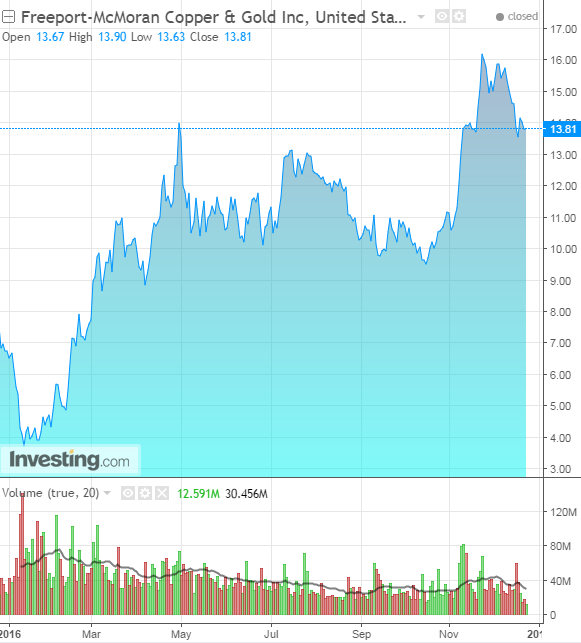
- Opening Price on January 4th: $6.60
- Price on December 23rd: $13.81
- Gains: +$7.21, +109%
- Sector: Metal Mining
At the beginning of the year it didn't actually look like Freeport-McMoran (NYSE:FCX) might make it through the year. Copper prices were down to $1.93, a seven year low. The company had over $20 billion in debt and FCX's Q4 2015 report included a net loss of over $4 billion.
The Q4 2015 report also mentioned the probability of at least a few more negative growth quarters, at least until gold prices moved higher. The company's shares—which had traded in the $30 range for a number of years—were, by by mid-January, available for $3.52. Since that low point, the company has pledged to deleverage its balance sheet by selling assets and limiting capital expenditures.
These efforts, in conjunction with a 25% jump in copper prices this year, have pulled the company back from the brink of bankruptcy and straight to the middle of the top five best performing SPX stocks of 2016. If you'd dared to open a long position on this miner at the beginning of this year, your profit would have beaten the SPX handsomely.
The year ahead: With commodity prices still low, Freeport is far from being safe bet. But we believe the worst has past for this particular company. As long as quarterly reports continue to signal FCX's commitment to the health of its balance sheet, and copper prices don't implode again, we think Freeport-McMoran might be able to reach the $20 mark in 2017.
#2. ONEOK, Inc.
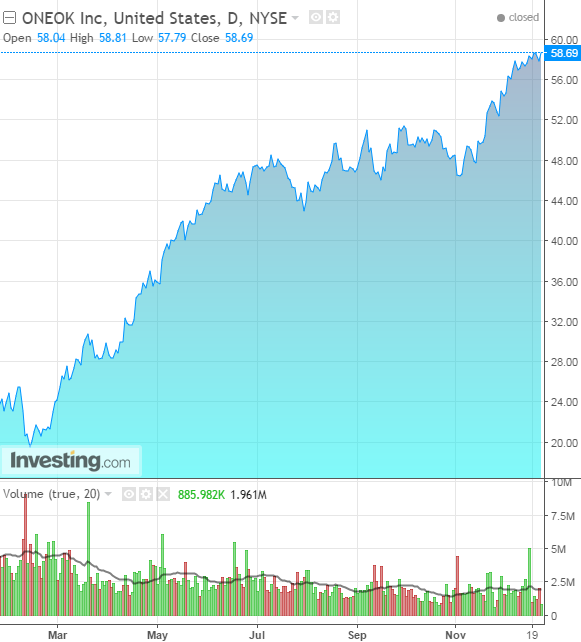
- Opening Price on January 4th: $24.66
- Price on December 23rd: $58.69
- Gains: +$34.03, +137%
- Sector: Energy – Natural Gas
For ONEOK (NYSE:OKE), a natural gas provider, the past nine months of 2016 have been the rainbow after the downpour. Much like other commodities, which have all been poor performers over the past few years, natural gas prices plummeted to $1.6 per million Btu in the first quarter of 2016—an 18 year low—because of a gas glut which led to an oversupplied market.
In 2015, the company's revenue fell more than 36%, and its net income took a 22% hit, leading to a disastrous year for the stock which lost just over 50%, falling from $49.90 to $24.66. Since then, natural gas prices have doubled, spurring OKE growth: revenue increased by 24% during the last quarter and the company has seen two straight quarters of overall growth after seven consecutive negative quarters. An additional win? The +135% jump in the stock price seen over the past year.
The year ahead: A little more stability for gas prices would be very welcome at ONEOK. The company's dividend has a very nice 4.2% yield which, with a 75% payout ratio is relatively solid. As income continues to grow, there's also been talk of resuming dividend growth. While we believe ONEOK's very strong share price rebound is largely over, the company should prove to be a solid investment in 2017.
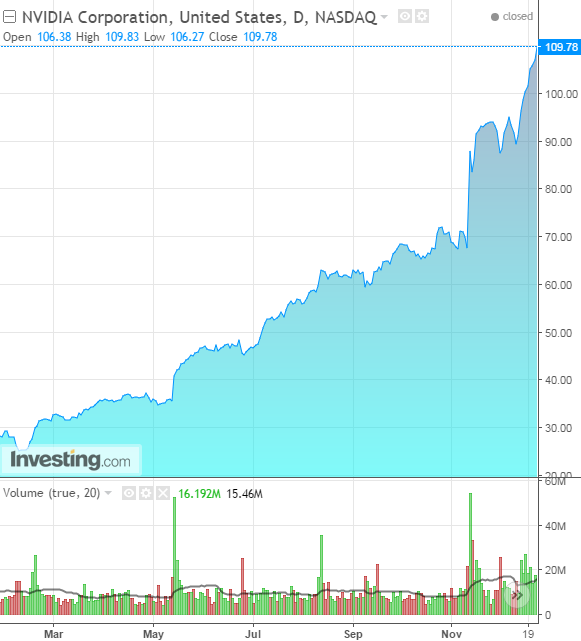
#1. NVIDIA Corporation
- Opening Price on January 4th: $32.29
- Price on December 23rd: $109.78
- Gains: +$77.49, +240%
- Sector: Semiconductors
Sometimes, albeit rarely, lightning does strike twice. NVIDIA Corporation (NASDAQ:NVDA) appeared on our list of top performers in 2015, coming in at number 4, when its stock price grew by 65%. Over the past year, NVIDIA built on that accomplishment, growing 400% over the past two years, or five times what it was worth two years ago.
In 2016, NVIDIA managed to replicate the immense success of its GTX970 with its newest series of processors, the GTX 10XX. Additionally, NVIDIA's involvement in fast growing sectors such as smart cars and the internet of things, as well as double digit growth in all aspects of its business, have catapulted the stock's price sky-high. While we expected a continuation of last year's uptrend due to NVIDIA's sector leadership, the 240% return exceeded all expectations.
The year ahead: Much like Amazon (NASDAQ:AMZN) after two straight years of incredible growth, we expect NVIDIA to give back some of its gains over the next calendar year. Of course, for savvy investors interested in jumping on the NVIDIA growth train for the longer term, this would provide a better entry point. We're serious fans of the stock and are hopeful it could correct downward by 20-25%, which would offer a mid-$80s entry-point. A bit more risky, but probably more likely entry point would be at $95 since it might not get to the mid-$80s any time soon.
Editor's Note: To read Part 1 of this series, click here; to read part 3, click here.
