After Wednesday’s impressive reversal in the S&P 500 futures, which saw a 30+ handle sell off from the intraday highs, all eyes were on the equity markets again Thursday. Traders were curious to see if there would be follow through from Wednesday’s selling as there were concerns about Trump’s meeting with Chinese representatives and other matters of the new president’s agenda.
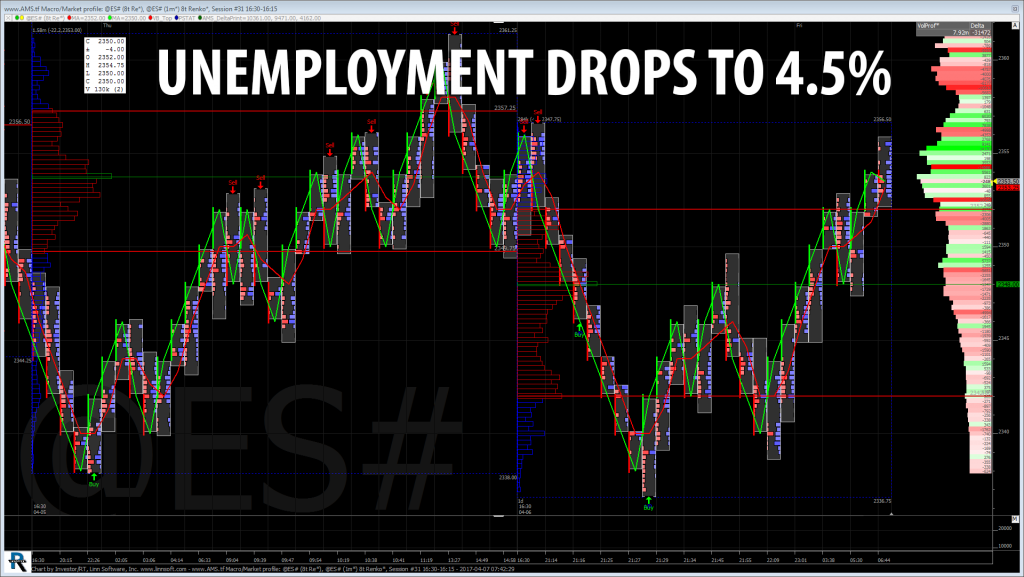
Following a relatively quiet overnight trade which saw the S&P’s bounce at 2338.00, near Monday’s low, the regular session opened at 2350.50, up four handles. From there the futures pushed down to 2345.00. On the open before buyers came in and kept a steady bid on the benchmark futures for the duration of the morning, as the ESM17:CME printed a high of 2361.25 just after 12:30 pm CST.
From there the midday buying dried up and left the S&P’s vulnerable going into the final part of the trading day. The MrTopStep Market-imbalance-Meter opened up showing just under $1 billion U.S. dollars on the sell side and the S&P’s reacted with weakness pushing down below the opening print down to 2349.50 and did make it back to 2355.00 area before settling the day at 2353.50, up seven handles.
MrTopStep has a rule that after a large sell off like we saw Wednesday, the futures will tend to go sideways to higher the following day, and that’s what was in store for Thursday’s trade.
At the end of the day the market-on-close imbalance was $1.2 billion to sell. It’s clear that the money has been coming out of the stock market since last week, and doesn’t seem to be comfortable coming back in. This week the auto sales numbers came in lower than expected to which BofA/ML said that If auto sales stay at last month’s poor 16.5m saar level for 2017, GDP will be all of ~10 bp lower, and Wednesday the PMI number came in as a miss, this after the ADP was better than expected.
Will any of this be enough to deter long term investors? I doubt it, it will take a lot more to sway long term equity flows, and according to the Jeff Hirsch post below, S&P could keep going higher.
Stock Trader’s Almanac
First 100 Days: March Weakness Sets Up 4% April Rally?
At the start of March we updated the S&P 500 Performance during the First 100 Days of new administrations since 1953 in a post titled “February Weakness Avoided, March’s Thunder Stolen?” Looking at the same chart updated through today’s close, March was indeed a dud. Instead of a respectable rally, S&P 500 fell 0.04% in March. As of today’s close it has been 75 calendar days since President Trump took office and S&P 500 has gained 3.9% which is still above historical average. Historically, March was a flat month for new Republican administrations (solid red line in chart above), but that weakness ended on average in early April and the S&P 500 rallied nearly 4% by the end of the month (black arrow). A similar result this year would put S&P 500 off this chart by the end of the month.
While You Were Sleeping
Overnight, President Trump ordered strikes against targets in Syria helping to push the S&P futures lower from the globex open of 2355.25 down to 2336.75 just after 8:00 pm cst. From there the futures found support and climbed higher for much of the session pushing this morning back up to 2355.75 just now, up 2.00 handles on the day and just two ticks from the high made on the globex open. In Asia, equity markets were choppy and mixed followed by Europe that has had an overall lower tone this morning.
In Asia, 6 out of 11 markets closed higher (Nikkei +0.36%), and in Europe 8 out of 11 markets are trading lower this morning (DAX -0.37%). Today’s economic calendar includes the Employment Situation, Wholesale Trade, William Dudley Speaks, Baker-Hughes Rig Count, Consumer Credit and James Bullard Speaks on Sunday Apr 9th.
Water in the Bathtub
Our View: Right now this is what we call water in the bathtub. The S&P futures are now on their fifth straight day (and 7 of last 9) of crossing both sides of 2350 in the same session. It’s a two sided market right now and fading the edges has been the trade. We have seen this before, prices hang within 2% or so of new highs and there is a lot of back and fill until the next push higher. So far the market is shrugging off a lot of things that would ordinarily be an excuse to sell if the market was looking for one, but the market doesn’t really seem to want to sell.
Our view is more of the same, 10 handle rules for the intraday and 20-30 handle rules for larger swing trading positioning. At some point this will break but until it does, mite as well play the chop. This morning’s NFP could be a quiet one, it use to be NFP day was the most active of the month, but over the last few months they have been quiet.
PitBull: CLK osc 26/-1 turns down on a close below 5210, ESM osc -1/-4 turns up on a close above 236474. VIX osc 3/1 turns down on a close below 1102.

As always, please use protective buy and sell stops when trading futures and options.


