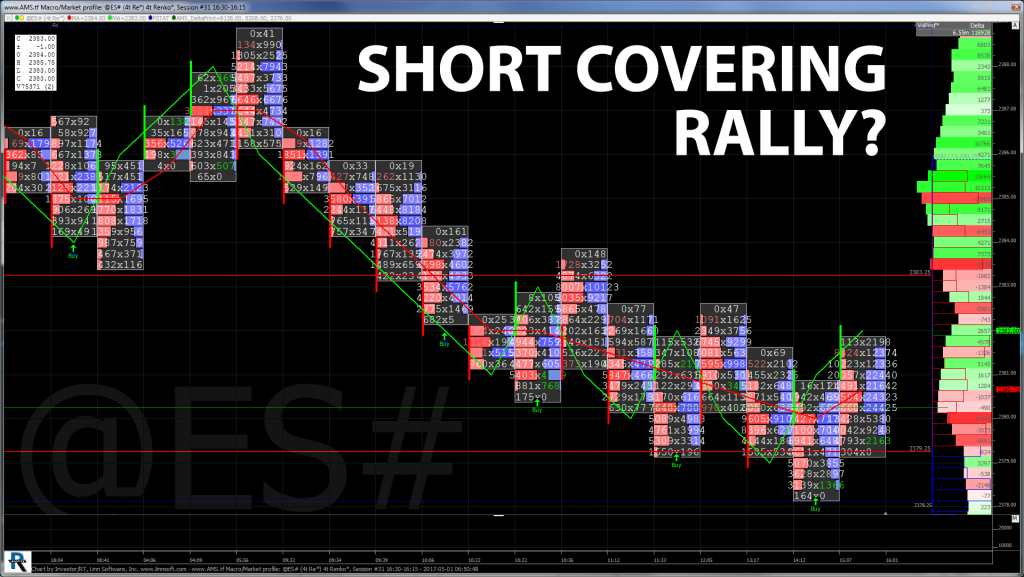
Last week, the S&P 500 futures gapped up to open more than 20 handles higher at 2365.75, after traders had gone into the prior weekend with large bearish sentiment ahead of the initial French polling. While Art Cashin said on Monday that it looked like a short covering rally, as hedges were removed, the futures continued to push higher. The S&P 500 futures closed up on Monday and Tuesday, before reaching a weekly high on Wednesday at 2394.75, just two ticks shy of being up 50 handles from the prior weeks close.
As the futures were storming higher, sentiment had abruptly turned from bearish, to everyone calling for new highs. With a greater than 2.5% rally early in the week, Wednesday did reverse, leading to lower highs and lower lows for the rest of the week. However, the pullback has been limited to 17.75 points, including last night’s low. So, after a 49.50 handle rally, bears haven’t been able to retrace 20 handles, and now sentiment is starting to shift back to calling tops.
On Friday’s trade, the futures opened the 8:30 am cst cash session at 2388.00, up 1.75 points. There was a one tick rally before sell programs hit the bid pushing the S&P’s through a series of lower lows on the day, down to a morning low of 2379.25, a 9 handle pullback. From there, the futures bounced up to 2382.50 midday, made a new low at 2378.25 mid afternoon, then rallied up to 2382.25 on the close before settling the day at 2380.50, down 4.75 handles.
Sell in May? Historically a Solid Month in Post-Election Years
From Stock Trader’s Almanac:
May has been a tricky month over the years, a well-deserved reputation following the May 6, 2010 “flash crash”. It used to be part of what we called the “May/June disaster area.” From 1965 to 1984 the S&P 500 was down during May fifteen out of twenty times. Then from 1985 through 1997 May was the best month, gaining ground every single year (13 straight gains) on the S&P, up 3.3% on average with the DJIA falling once and two NASDAQ losses.
In the years since 1997, May’s performance has been erratic; DJIA up nine times in the past nineteen years (three of the years had gains in excess of 4%). NASDAQ suffered five May losses in a row from 1998-2001, down – 11.9% in 2000, followed by ten sizable gains in excess of 2.5% and four losses, the worst of which was 8.3% in 2010. Post-election-year Mays rank at or near the top.
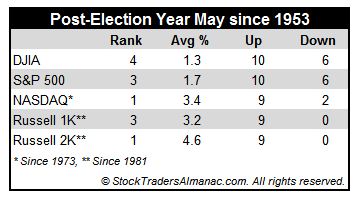
May is the top performing NASDAQ and Russell 2000 month in post-election years. The Russell 2000 has been up 9 straight with gains averaging a whopping 4.6%. DJIA and S&P 500 (since 1953) have been nearly as strong, with May ranking 4th and 3rd respectively.

May begins the “Worst Six Months” for the DJIA and S&P. To wit: “Sell in May and go away.” Our “Best Six Months Switching Strategy,” created in 1986, proves that there is merit to this old trader’s tale. A hypothetical $10,000 investment in the DJIA compounded to $843,577 for November-April in 66 years compared to $319 loss for May-October.
While You Were Sleeping

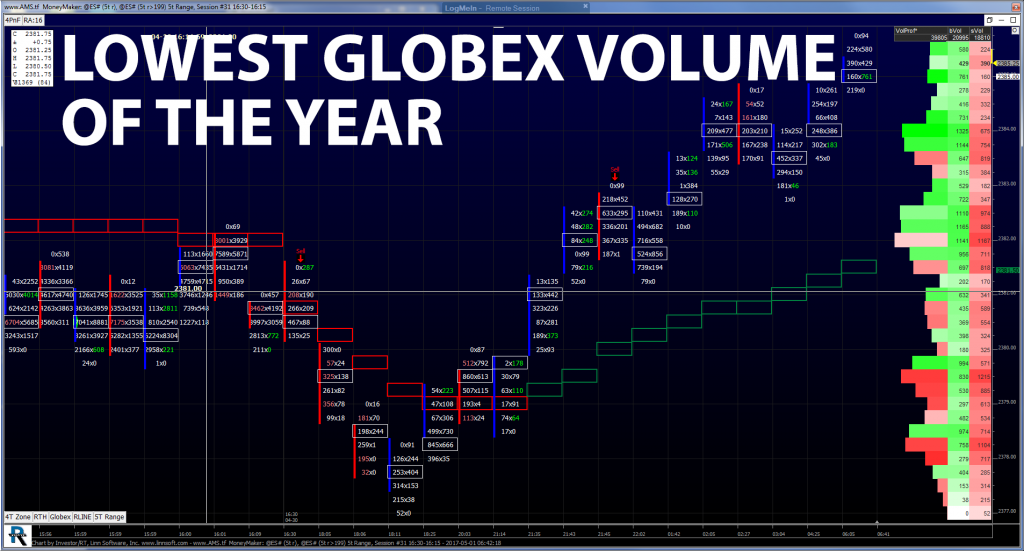
Overnight, Asian equity markets were quiet, choppy and mixed, followed by a European session which is showing nearly all markets modestly lower. In the U.S. the S&P 500 futures opened the globex session at 2381.50, and immediately pushed down to the session low of 2377.00 before reversing and rallying nearly 9 handles, up to 2385.75. as of 6:30 am cst, the ESM is trading three ticks off that high with only 43k contracts traded, which is shaping up to be the smallest globex volume all year for a regular session day.
In Asia, 6 out of 11 markets closed lower (Nikkei +0.59%), and in Europe 10 out of 12 markets are trading lower this morning (FTSE -0.46%). This week’s busy economic calendar features FOMC and NFP, and also includes 27 other reports, 5 Fed speakers with Chair Yellen on Friday, and 16 U.S. Treasury events. Today’s economic calendar includes a 2-Yr FRN Note Settlement, a 2-Yr Note Settlement, a 5-Yr Note Settlement, a 7-Yr Note Settlement, Personal Income and Outlays, PMI Manufacturing Index, ISM Mfg Index, Construction Spending, a 4-Week Bill Announcement, a 3-Month Bill Auction, a 6-Month Bill Auction, and Gallup US Consumer Spending Measure.
Our View: First Day of May = Bullish
According to the Stock Trader’s Almanac, the first trading day of May is historically bullish, with the S&P 500 closing higher 15 of the last 22 years. The average gain on this day is more than half a percent.
The futures rallied overnight, and today begins a busy week of economic reports. While the overnight volume has been exceptionally low, it’s bound to pick back up sometime this week.
Our view is that the S&P is on its way to 2400, and beyond, but just not sure about it today. Sell the early/mid day rallies, and buy weakness.
Market Vitals for Monday 05-01-2017
As always, please use protective buy and sell stops when trading futures and options.


