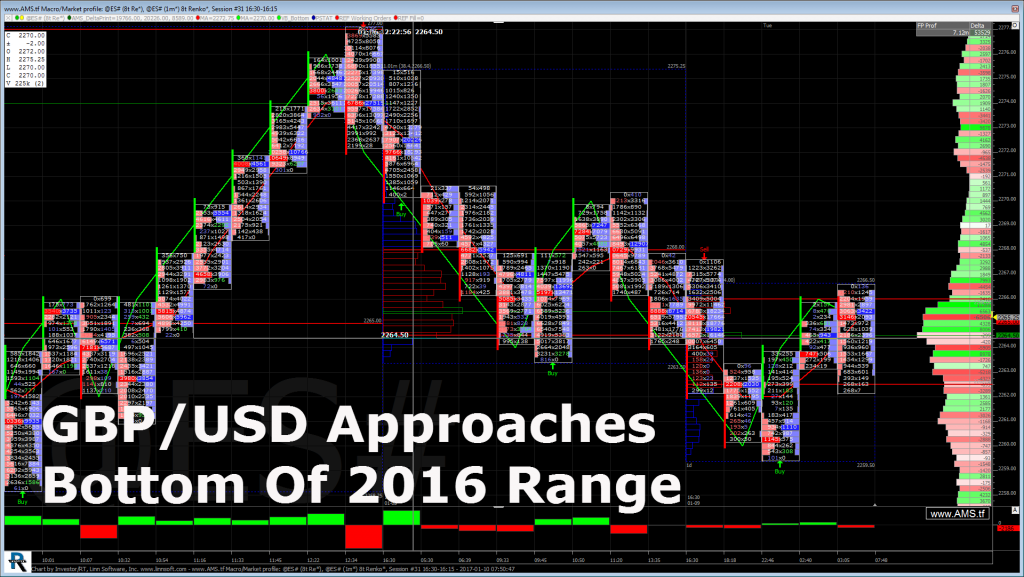
Well, there have not been a lot of down days lately, but yesterday was one of them. It was also a horribly slow day with little to no trading volume. Why? The first reason is the level of ‘risk reward’ with the S&P’s up so much over the last 8 or 9 weeks. The other is that some people are still on vacation and not back trading yet.
The big things on traders minds are, is the S&P getting toppy, and is the current let down just going to lead to new all time highs? That’s a good question, so I asked my good friend Jeffrey Hirsch to tell us what the stats have to say, and Jeff said this…
The January Trifecta
Even though today turned out to be a mixed day for the market (DJIA and S&P 500 down, NASDAQ up), S&P 500 is still positive year-to-date and thus our First Five Day (FFD) early warning system is also positive. Combined with last week’s positive Santa Claus Rally (SCR), our January Trifecta is now two for two. The January Trifecta would be satisfied with a positive reading from our January Barometer (JB) at month’s end.
When all three indicators, SCR, FFD and JB, are positive this has been the most bullish scenario for the next eleven months, and the full year. In 28 previous Trifecta occurrences since 1950, S&P 500 advanced 89.3% of the time during the subsequent eleven months, and 92.9% of the time for the full year. However, a January Indicator Trifecta does not guarantee the year will be bear free. The three losing “Last 11 Mon” years, shaded in grey, experienced short duration bear markets (2011, S&P 500 –19.4% peak to trough).
A positive SCR and FFD are encouraging, and further clarity will be gained when the January Barometer (page 16, STA 2017) reports at month’s end. A positive January Barometer would further boost prospects for full-year 2017. The December Low Indicator (2017 STA, page 44) should also be watched with the line in the sand at DJIA’s December Closing Low of 19170.42 on 12/2/16.
Hard Brexit
Yesterday, equity markets were weak, helped by comments from British Prime Minister Theresa May suggesting that the plan she was about to unveil concerning the Brexit called for a clean break, or a “hard Brexit.” May continued to say “We must think about this, as somehow we’re coming out of membership, but we want to keep bits of membership,” she said. A lot of folks, apparently, were betting that the U.K. would indeed keep some ties to the EU. May’s comments squashed that bet.
All of this helped the GBP/USD sell off and approach the bottom of the 2016 range. The S&P 500 futures opened the cash session at 2268.75, down three handles, and traded to an early low of 2263.50. There was an early morning bounce up to 2270.25, and then the ESH traded back to within a tick of the day’s low. From there, the futures only saw a modest lift, as MOC orders built up to $800 million to buy. That rally was short lived, as the S&P was weak into the close, settling the day at 2265.00, down 6.25 handles.
While You Were Asleep
In the overnight trade, both Asia and Europe have seen a mixed and mostly quiet trade. Meanwhile, the S&P futures traded down to 2259.50 about an hour before the European open last night, but have since rallied back up to above yesterday’s close. The ESH17 made a session high of 2266.50, and as of 6:46 am cst, has last traded 2265.50, up two ticks on the day, with volume at 91k.
Asia and Europe
In Asia, 6 out of 11 markets closed higher (Nikkei -0.79%), and in Europe 6 out of 11 markets are trading higher this morning (FTSE +0.45%). Today’s economic calendar includes the NFIB Small Business Optimism Index, Redbook, JOLTS, Wholesale Trade, a 4-Week Bill Auction, and a 3-Yr Note Auction.
Our View
Despite $800 million to buy on the close, the S&P rallied slightly and then sold off late in the day, and on Globex. At 9:20 pm CT last night the ESH17 traded down to 2261.25, then made another new low at 2259.50 around midnight, before rallying back up to 2266.50 this morning. Is the S&P ‘toppy?’ It sure looks that way, but the last time the ES closed down two days in a row was back on Dec 21st & 22nd. The ES should bounce at some point today. Our view, you can sell the rallies and buy weakness, or just wait for the pull back and ‘buyem.’
As always, please use protective buy and sell stops when trading futures and options.

