After Google (NASDAQ:GOOGL) reported better than expected earnings, and the stock sold off, taking the Nasdaq 100 futures (NQU17:CME) down 25 points after Mondays close, no one expected the S&P 500 futures (ESU17:CME) to gap up on the 8:30 CT open. With the ES up 14 days out of the last 17 sessions, and the NQ up 12 out of the last 13, the bears are still calling for a sell off / pull back that never seems to come.
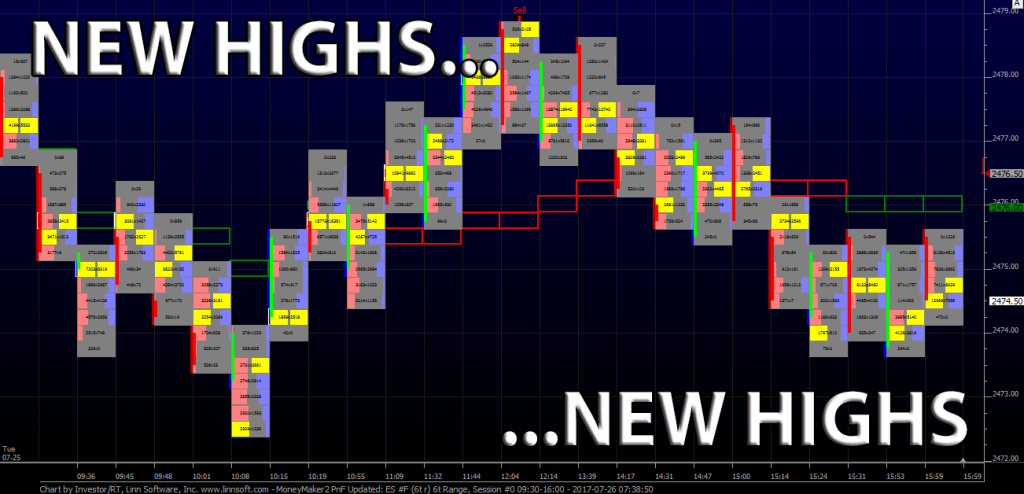
After making a new all time contract high at 2478.25 on the 8:30 ct time futures open, the ES sold off below the vwap at 2472.50, and then rallied up to 2476.75. From there, the futures pulled back 1 tick above the vwap at 2474,50. It’s hard not to be bullish, but I think the indices are way over extended, and sell stops are starting to build up below. The main question is, can the markets sell off in this low volume, low VIX environment?
After the small pull back, the ES traded back up to 2478.75, two ticks above the earlier high, and sold back off down to the vwap at the 2475.50 area as the health care vote started. At 2:25 CT the ES was trading 2473.75 on total volume of 870,000 contracts. Going into the 2:45 cash imbalance, the ES sold off down to 2473.25 as the MiM went from sell $400 million, to buy $ 1.45 billion. We were not sure if it was a ‘switch’, or some type or rebalance. At the end of the day the (ESU17:CME) settled at 2474.00, up +5.5 handles, and set another new all time high.
The big talk is about the VIX, and how low volatility is. Below is a great overview of the VIX, past and present. Can the VIX go lower? We think it can, but we also think the lower it goes, the higher the risk of a reversal. There are some very big bets being made right now that the next big move will be the S&P going down and the VIX goes flying up… Only time will tell.
VIX All-Time Lowest Close
All-time lowest VIX close was 9.31 on 22 December 1993.
So far there have been only 9 trading days when VIX closed below 10.
(Available VIX data history goes back to January 1990)
VIX All-Time Intraday Low
All-time lowest VIX intraday value was 8.89 reached on 27 December 1993.
This was the only day in history when the VIX was trading below 9.
There have been 18 trading days in history when the VIX was trading below 10 intraday.
10 Lowest VIX Closing Values in History
The following table shows 10 days with lowest VIX closing values:
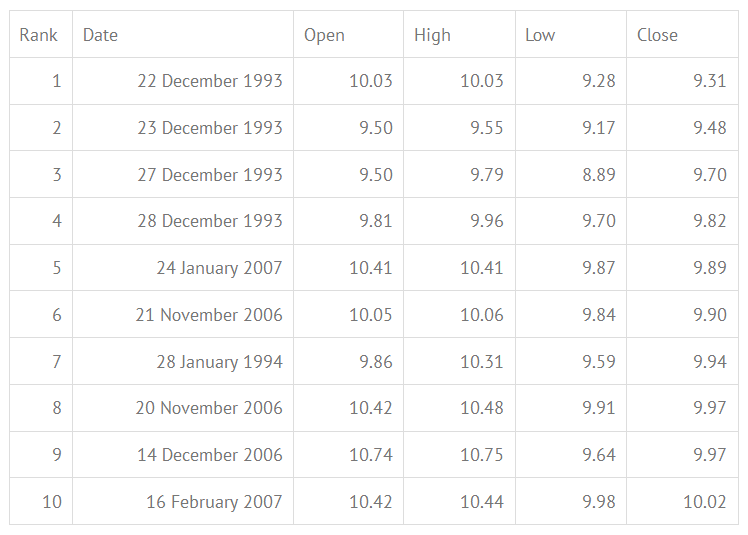
You can see that all of them occurred either in December 2003 – January 2004 or in November 2006 – February 2007. These two periods have been the long-term lows in VIX, as you can see in the chart below:
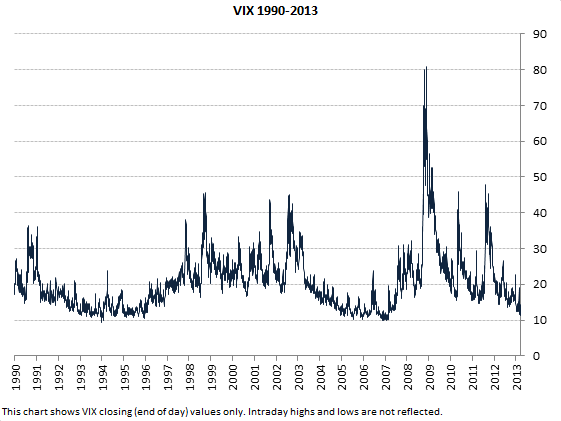
It also appears that the VIX is now heading to another big long-term low, but of course no one can tell what the lowest value will be this time. You can also see that the periods of very low VIX can be very long (several years) and the mere fact that the VIX is 10, 11, or 12 does not necessarily mean that it must go up soon.
VXO (Old VIX) All-Time Low
Data for the VIX index is available starting from 1990, but big part of that was back-calculated, because the current VIX calculation method is used only since 22 September 2003. Data for the old method is still being published by CBOE under the symbol VXO. It goes back to 1986 and therefore provides a few additional years of history. You can see VXO chart below:
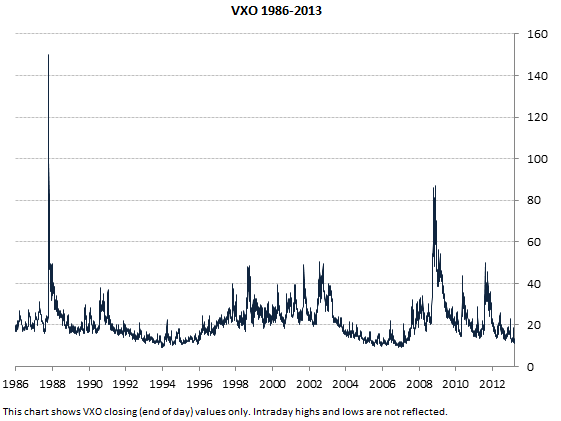
VXO all-time lowest close was 9.04 on 23 December 1993 (the same day as VIX all-time low).
VXO all-time intraday low was 8.86 again on 23 December 1993.
There have been 42 trading days when VXO closed below 10, 3 trading days when VXO was below 9 intraday, and 64 trading days when VXO was trading below 10 intraday. These numbers are higher than the corresponding VIX numbers, but the reason is not the longer VXO history (you can see in the chart above that the first VXO history years saw much higher values, including the super-spike on the Black Monday in 1987). The reason for higher number of extremely low values in VXO vs. VIX is simply different calculation of the two indices.
Here you can see the differences in VIX vs. VXO calculation (“New vs. Old VIX Calculation” – almost at the end of the page).
Here you can see similar statistics for VIX and VXO all-time highs.
While You Were Sleeping
Overnight, equity markets in Asia traded mostly higher, once again led by the ASX 200, which closed up +0.87%. In Europe, most markets are trading higher this morning, with the exception on the PSI 20 Index, which is down -0.14%.
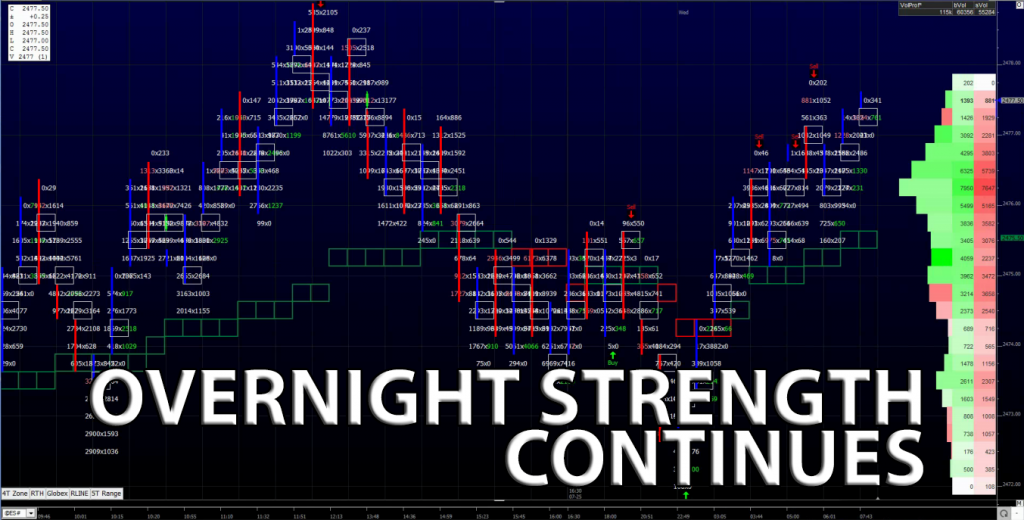
In the U.S., the S&P 500 futures opened last nights globex session at 2475.25, and traded in a 4 handle range for most of the night. As Asian stocks were closing, and European stocks were opening, the ES caught a bid, and traded up to a new high of 2477.75 at around 4:30am CT. As of 7:00am CT, the ES is trading on new highs again, and the last print is 2478.25, up +4.25 handles, with 113k contracts traded.
In Asia, 7 out of 11 markets closed higher (Shanghai +0.12%), and in Europe 11 out of 12 markets are trading higher this morning (FTSE +0.35%). Today’s economic calendar includes the MBA Mortgage Applications, New Home Sales, EIA Petroleum Status Report, a 2-Yr FRN Note Auction, a 5-Yr Note Auction, and the FOMC Meeting Announcement.
Our View
Higher prices it was, but the gap higher left the S&P in no man’s land for most of the day. The only real trades were selling the open, and buying on the sell off when the ES went off down to 2472.50 at 9:15. The rest of the day was a big ‘chop’.
Our view is that there is a very high probability that the Federal Reserve will raise interest rates. We lean to buying the early weakness and selling rallies.
PitBull: CLU osc 2/10 turns down on a close below 45.59; ESU osc 18/13 turns up on a close above 2484.40; VIX osc -9/-6 turns down on a close below 8.82.
