Investing.com’s stocks of the week

During the 2007-08 credit crisis the U.S. Federal Reserve lowered rates a total of 10 times. In addition to taking interest rates down to zero they also implemented a bond buying program and quantitive easing programs. This pumped U.S. dollars back into the system and in turn supported the US financial system. Exactly 10 years later the S&P 500 futures (ESM17:CME) has tripled in price, the Nasdaq is trading back above the 2000 Tech bubble high, and the Dow Jones has surpassed 20,000 and is nearing 21,000.
That is the good part. The $1,924,542,900,000 debt the program has caused (http://www.usdebtclock.org/) is the bad part. No one can argue that zero borrowing costs helped stimulate the economy, but did the program actually have to go on as long as it did? Should the Federal Reserve have been more active in raising rates? I think they should have been, and I also think that Donald Trump thinks the same thing. So here lies the question; if lowering rates to zero helped stage an economic recovery in the U.S., will raising interest rates have the reverse effect?
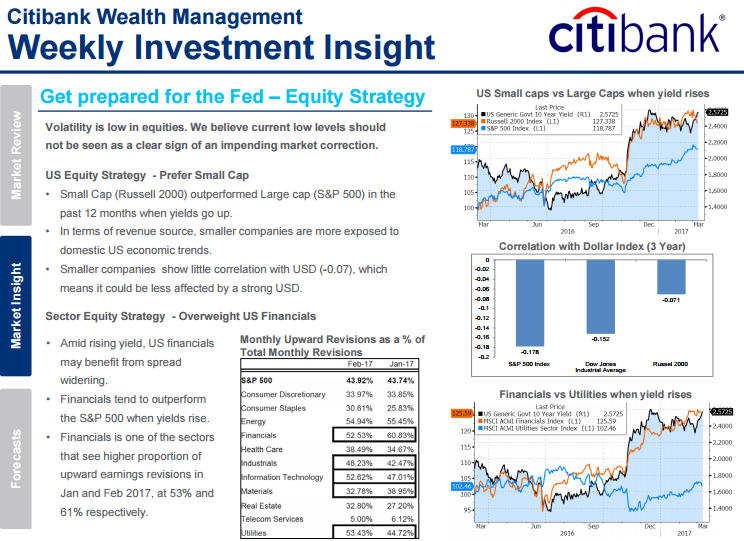
As the U.S. debt clock increases, the time for the Federal Reserve to raise interest rates is getting shorter. Since taking interest rates to zero, the fed has missed several opportunities to increase, but that will not be the case in 2017. The U.S. economy is on a roll, and instead of going slow there is an increased chance that the rate hikes come faster, and possibly larger, than the public thinks.
I am writing today’s Opening Print early, and as I am writing, the S&P futures have gone from an early Sunday night Globex low of 2365.25 up to the 2371.00 area. Several traders I spoke to think that Wednesdays rate hike will cause a sell off in the S&P. I can’t disagree, but like most ‘events’ in the S&P, there is always a rally at some point, and I do not think that’s going to change anytime soon.
On Monday mornings 8:30 ct futures open the (ESM17:CME) traded at 2368.25, then shot up to a new high at 2372.00, and that’s when I blasted this out:
IMPRO:Dboy:(9:36:02 AM):I think we pull back
IMPRO:Dboy:(9:36:18 AM): don’t think we can go too far either way
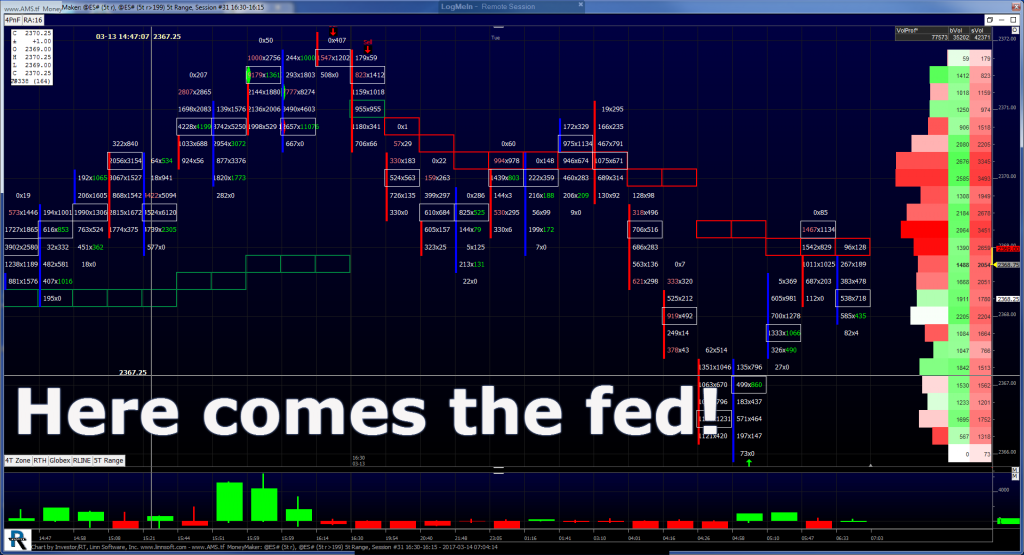
Not long after, the S&P 500 futures started to drop, sold off under the vwap, and ‘triple bottomed’ at 2367.00. From there the ES made one last push down to 2365.50 going into the Euro close and then back and filled sideways for much of the midday. There was a late day rally up to 2372.00, on a market-on-close imbalance of $800 million to buy, before settling the day at 2371.75, up 3.5 handles. The economic calendar was very light yesterday, and this combined with the pending storm to hit the East Coast, no doubt contributed to the lackluster session.
While You Were Sleeping
Overnight, equity markets in Asia were very quiet but mostly higher followed by a lower, but very quiet, European session. The S&P 500 futures opened globex at 2370.75 and made a high of 2371.50 then traded lower for much of the session. The low at 2366.00 was made a couple hours into the European session, completing a 5.50 handle range, and as of 6:00 am has last printed 2368.75, down 3 handles on volume of 142k.
In Asia, 7 out of 11 markets closed higher (Shanghai -0.07%), and in Europe 8 out of 11 markets are trading lower this morning (DAX -0.10%). Today’s economic calendar includes the beginning of the FOMC Meeting, NFIB Small Business Optimism Index, PPI-FD, Redbook, and a 4-Week Bill Auction.
Steady As She Goes
Our View: Yesterdays total day range in the ESM was only 6.5 handles. When you look at the 1.6 million (ESM17:CME) futures that made up yesterday’s total volume, you have to take out the 275k contracts traded on Globex, and then subtract the 725,000 (ESH17:CME / ESM17:CME) spreads, that leaves only 600k contracts traded in the day session. And guess what? Today should be a repeat.
At the end of the day no one knows for sure what the S&P is going to do next, but from my vantage point, the ES has made some higher lows and is back and filling on top of the low volumes. In most cases that generally leads to a pop, but that might not happen until Wednesday. While the public seems to be in a risk reverse mood, there’s a good chance that ‘thin to win’ plays out.
Our view is the same as yesterday, you can sell the early rally and buy weakness, or just be patient and buy weakness.
PITBULL: clk osc -54/-10 turns up on a close above 4809, esh osc -4/14 turns down on a close below 236456, vix osc -1/2 turns up on a close above 1231.
As always, please use protective buy and sell stops when trading futures and options.
- In Asia 7 out of 11 markets closed higher: Shanghai Comp -0.07%, Hang Seng +0.01%, Nikkei -0.12%
- In Europe 8 out of 11 markets are trading lower: CAC -0.32% DAX -0.10%, FTSE +0.21% at 6:00am ET
- Fair Value: S&P -2.81, NASDAQ +4.40, Dow -43.59
- Total Volume: 1.6m SPH, 1.0 mil ESH, 25k SPM, 23k SPM traded


