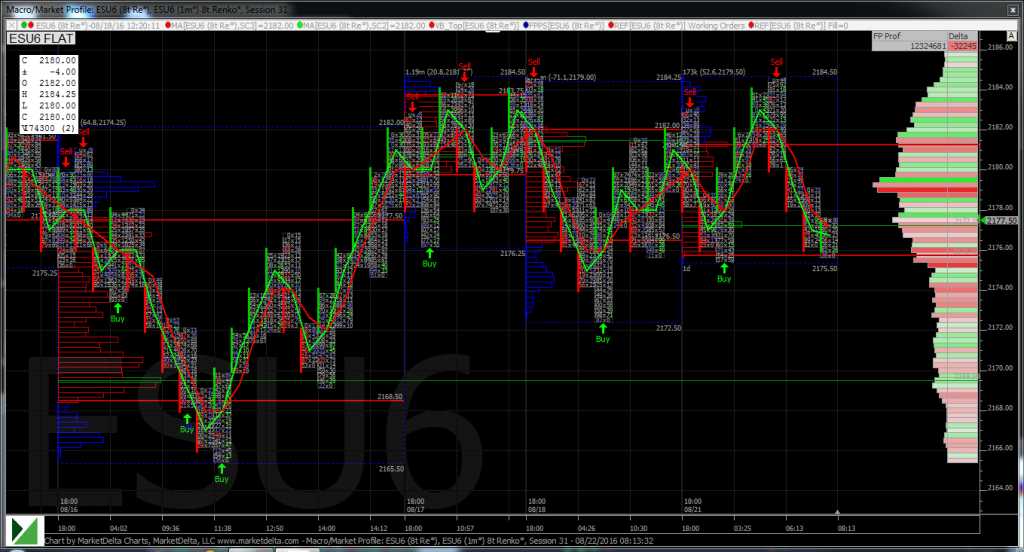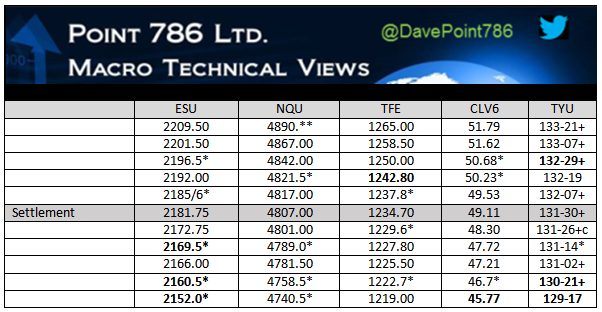
The S&P was firm on Thursday’s close then sold off on Globex overnight. After another sell off on Friday mornings 8:30 CT RTH open, the ES did what it does best, it ripped higher. While the sentiment still remains bullish many traders are starting to think the S&P maybe setting up for a sell off. While we can not rule out something like that, we also think the current price action in the S&P futures has not changed, meaning sell off a little and rally. Until that changes we still think S&P 2200.00 is on tap.
Record Inflows for 2016
For several weeks the S&P 500 futures have been stuck in narrow trading ranges. Last week it looked like the futures were poised to take out the highs, but they fell back into the same range it’s been trading in. According to Bank of America’s Merrill Lynch, global investors continue putting money to work in stocks. Over $5 billion went into global stock funds last week bringing the total inflows to $11.6 billion over the last two weeks.
After a shaky start to 2016, and a more than 10% drop, the S&P has recovered to make new all time record highs over the summer. The rally had done little to reassure investors that continue to pull money out of stock investment funds. According to Credit Suisse (SIX:CSGN), July outflows ‘deepened’ to the worst month in six years after $52 billion was pulled from stock funds in the first 6 month of 2016.
Global Markets
Overnight global equity markets have traded mostly weaker. The ESU6 traded lower on the Asian session, making a 2175.50 low going into the Euro open, before continuing the routing of a European bounce. The index futures pushed up to 2184.50 shortly after 4:00 am cst before selling off again. The ES currently sits a tick above globex low, on volume that has hit about 150K before 6:30 am cst this morning, which is higher than the recent globex trend.
This week offers several relevant economic reports and Janet Yellen’s speech. Usually after the markets have been slow in the summer they begin to pick up gradually in late August before Labor Day. That is what we may start seeing this week. If volume picks up, then this will likely lead to some downside price action, or at least some real two sided opportunities.
I did speak with one desk manager who believes that the current market slowdown will last beyond Labor Day and until the Presidential debates. One thing I do know is that, as tired as traders are of this range, the market won’t change until it has a reason to change. In the meantime we play both sides, still giving respect to the buyers who prop up every dip, but knowing there is weakness on every new high. As much as the market seems difficult now, looking back, it will seem to have been easy to trade.
Early Weakness/Late Strenght
This week the bulls need to hold above 2172 and finally make the push up to the 2200. Remember, the last few weeks have seen weakness in the early part of the week, and strength later in the week. Bears need a push to close below last week’s 2165 low then follow through to 2155 and then 2145. It seems like a lot to ask from sellers who have been exhausted by a couple 10 handle dips.

In Asia, 6 out of 11 markets closed lower (Shanghai -0.75%), and in Europe 9 out of 12 markets are trading lower this morning (DAX -0.38%). This week’s economic calendar features the two day Monetary policy symposium and Janet Yellen’s speech, and includes 21 reports and 12 US Treasury events. Today’s economic calendar includes Chicago Fed National Activity Index, a 4-Week Bill Announcement, a 3-Month Bill Auction, and a 6-Month Bill Auction.
Our View
I am bullish, but I have to admit, there are some red flags popping up. Goldman Sachs (NYSE:GS) Prime Brokerage reporting a surge in net long exposure to 63%, approaching the highest levels in 12 months and rising from below 50% in Q2, is probably not a good sign. That said, the ES closed more than 210 handles above the June 27th 1981 low, and 9.75 handles off it 2190.75 high. Guessing when the ES will break out of its mold, or narrow range and small net changes, just has not happened yet, so we / I have to go back to the existing patterns of selling off and going back up.
Is ES 2200.00 still on TAP? I think so… It’s possible the ES stays kind of weak for the first few days of the week, then starts going back up later in the week. Our view is to sell the early rallies and buy weakness. I doubt the S&P is going to go down very much.
