After the announcement on Friday that the FBI was resuming their inquiry into the Clinton emails, and then some damaging Wikileaks showing John Podesta’s emails, the U.S. equity markets already appeared fragile to a noticeable uptick for Trump in the polls. Then yesterday, many of the updated polls started being released, including one from ABC News, that showed Trump with his first lead since they started tracking Clinton/Trump head to head last year.
As news hit the tape, facts and rumors entered into the markets, and the S&P 500 futures began to tumble. The equity sell off shows that it was more than just a ramp on the thin booked futures in the globex trade conducted by algos. The selling occurred on the 8:30 am cst market opening as a sideways market withdrew risk from the table heading into what could be a very volatile election. With the S&P 500 stalled up at 2150, investors and portfolio managers assessed that the risk was to the downside.
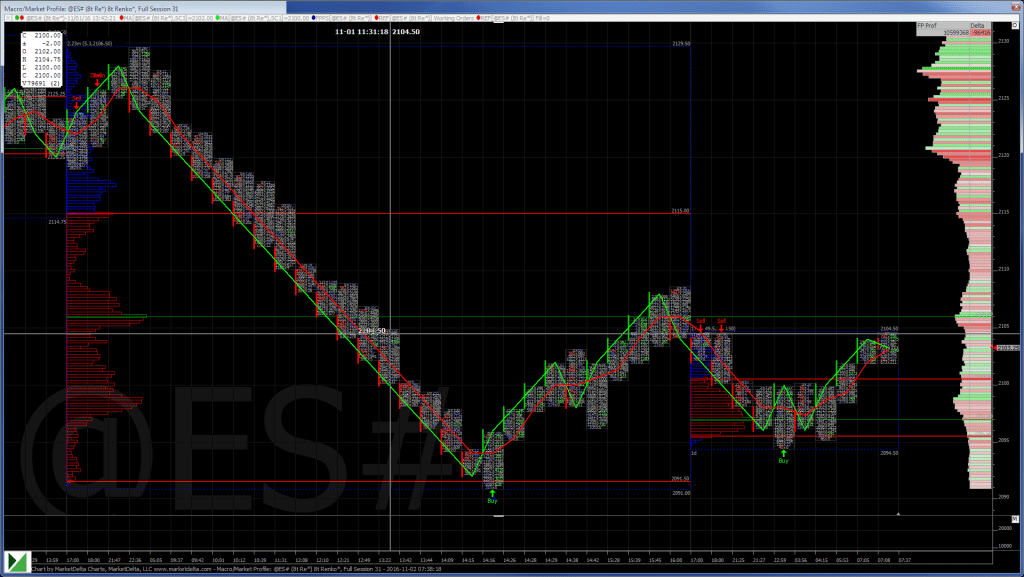
The ESZ6 made it’s cash session open at 2125.00 and saw a high of 2125.50. Until the 1:15 low was made the market only saw as much as a four handle bounce. The low came in at 2091, down 34 handles from the opening price. The futures did find some relief at that time, bouncing up to 2108.50 just before settling at 2104.00, but the damage was already done.
We have been mentioning how important it is for the S&P’s to close below 2120 for bears. What they got was a push below the September 2100 low, and a close in the lower half of the day’s range. Bears did what they needed to do to start, however, the case has been, ever since the February 11th low this year, that bears drop the ball when they need to follow through. This was the case after Brexit, and when the S&P dumped in early September. Bears need to keep the pressure on the bids, and make a close this week below 2100, setting up for 2050 next week.
From Stock Trader’s Almanac:
Election Day Seasonality Suggests Market Rally
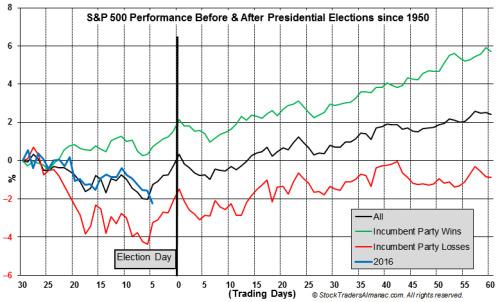
October did live up to its reputation of being weak in Election years. For S&P 500 October’s 1.9% decline was its second worst monthly performance this year and it was also the third consecutive down month. DJIA has also declined in three straight months. NASDAQ and Russell 2000 suffered the most damage in October, off 2.3% and 4.8% respectively. October’s poor performance in presidential election years has historically been accompanied by an incumbent party loss since 1952 (see page 28 of Stock Trader’s Almanac 2016). In the following chart the 30 trading days before and 60 trading days after the last 16 presidential elections are plotted.

In the above chart, Election Day is Day 0. Prior to 1984, the market was closed on Presidential Election Days so the close on the day before was used. Since 1984, the close of trading on Election Day was used. Day 26, to the left of “0” was the first trading day of October in 2016. As of today’s close, S&P 500 is suggesting an Incumbent party defeat. It is also noteworthy to observe weakness across all three lines between 10 to 5 Trading days before Election Day and then a rally from right around 5 Trading days before to Election Day.
Overnight, both Asian and European markets were filled with sellers, as all major markets were lower following Wall Street’s lead on Tuesday. However, the S&P futures maintained well, showing its first sign of strength during overnight weakness. The ESZ opened globex at 2102.25 and traded as low as 2094.50 early in the Asian session before rallying up to 2104.50. The ES is currently trading unchanged, three ticks off the high, on volume of 175K as of 6:35 am cst.
Brexit Repeat
In Asia, 11 out of 11 markets closed lower (Nikkei -1.76%), and in Europe 11 out of 11 markets are trading lower this morning (DAX -0.92%). Today’s economic reports include MBA Mortgage Applications, ADP Employment Report, Gallup U.S. Job Creation Index, Treasury Refunding Announcement, a 3-Yr Note Announcement, a 10-Yr Note Announcement, a 30-Yr Bond Announcement, EIA Petroleum Status Report, and the FOMC Meeting Announcement.
Our View: A few weeks ago I started talking about the S&P having a ‘weird feel to it’ and I have continued to say that, along with things like ‘something’s missing.’ I also talk about long hedge fund exposure and the public being ‘scared and risk reverse.’ I said the ES would eventually break out of its 2120-2150 trading range, and when the ES traded down to 2112.50 on Friday (below the 2120 bottom of the range) and everyone started talking about 2116 and 2106, I knew the S&P was in trouble.
I have been saying for over a month that the public has been running scared or concerned about the election. With the fed minutes today, the jobs number on Friday and the election next Tuesday, people are cutting back from trading, and the big investment firms and hedge funds are ‘hedging up positions.’ At the end of the day the US is afraid of a Brexit repeat. Trading is all about patterns, and one has to wonder, if the selling continues into the election, if there won’t be a big rip back.
While down, the S&P is far from out. Today is the second trading day of November, and the start of the best 6 months for stocks. You can’t rule out some first of the month buying. Yesterday the MiM was over $300 million to sell, when the ESZ6 was on its low, and ended up almost $500 million to buy, and a 17 handle rally. Our view this morning is that we think the ES can rally, but we also can’t rule out a retest of the 2094.75 globex low, or yesterday’s 2091.00 day low. Crude oil sold off down to 45.83 this morning, and the foreign markets are down across the board.
As always, please use protective buy and sell stops when trading futures and options.
