Recent IPO growth stock Roblox (NYSE:RBLX) has broken out to new highs and is cruising steadily higher. Here’s a simple chart walk-through of the breakout entry that is on its way to a big gain.
In our previous post, Why Funds May Be Ready to Rotate Back in to Explosive Tech Stocks Again, we explained that funds may be starting to move out of value stocks and back in to growth stocks.
We are currently continuing to see more bullish confirmation of this trend this week, led by strong price action in tech growth stocks like RBLX, UPST and APP.
On May 21, we notified subscribers that we were buying Roblox in the Wagner Daily model portfolio.
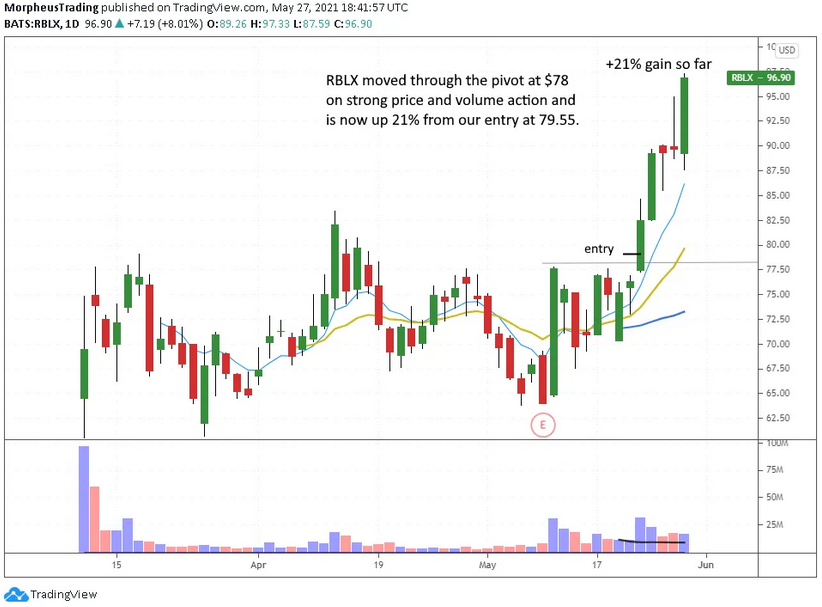
As of the May 27 close, our RBLX position is currently showing a price gain of +21% since our entry point.
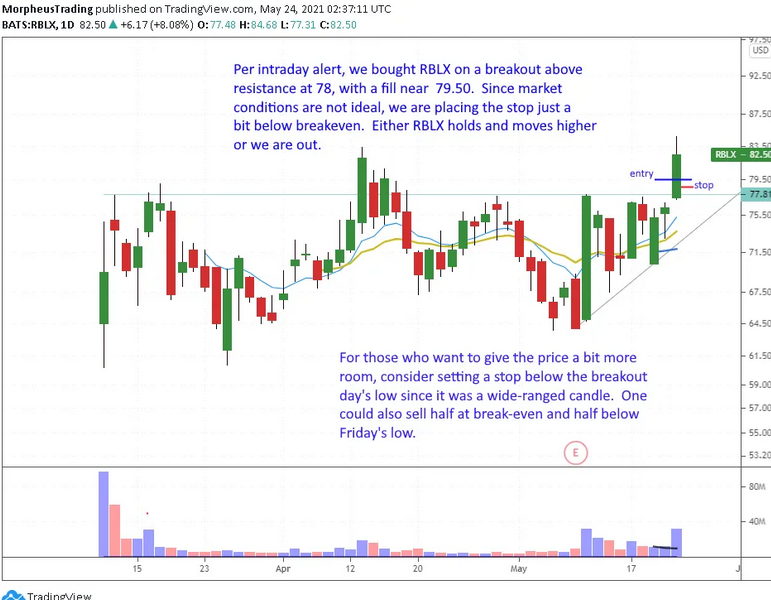
The annotated daily chart below shows the pattern and trade setup at time of entry:

The horizontal line on the chart above shows the breakout level we were targeting going for entry going into May 21.
That day, RBLX broke out on heavy volume and closed +8% higher.
Our original stop price at the time of entry was just below the 10-day exponential moving average (teal line), but we raised the stop to just below break-even the next day.
As mentioned on the chart, market conditions are not been ideal because the NASDAQ Composite was below both its 20-day and 50-day moving average (not on a “buy” signal) when we bought RBLX.
Given current market conditions, we have been using tighter stops than usual in order to minimize risk–we want to immediately be right OR get right out!
The chart below shows the RBLX price action since our entry point:

After buying RBLX on May 21, the stock followed through with another +8% gain the next day, on heavier than average volume (a bullish signal).
Since then, RBLX has continued to work its way higher and is currently showing a gain of +21% since our entry.
From here, we will continue trailing the stop higher in order to maximize gains and minimize risk.
