Weren’t lower oil prices supposed to act like a “tax cut” for U.S. households? If families spend less at the gas pump, then they will spend more of their dollars at the mall. At least that’s what mainstream media cheerleaders like CNBC’s Jim Cramer have insisted throughout the year.
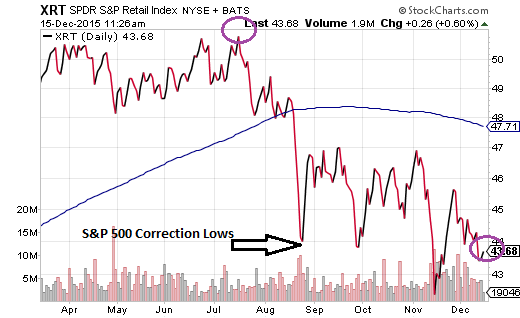
In contrast, the S&P SPDR Retail Index (N:XRT) demonstrates that investors are not particularly impressed by the prospects of American retailers. The current price for the exchange-traded fund tracker is lower than the price during the summertime stock market correction. What’s more, XRT is trading 14% below its 2015 high.
Well, okay. Maybe consumers are pocketing some of their gasoline savings. Maybe they’re choosing to pay down some of their debts. No matter. Lower energy costs surely must boost bottom line profits of transportation companies – truckers, airlines, shippers, railways.
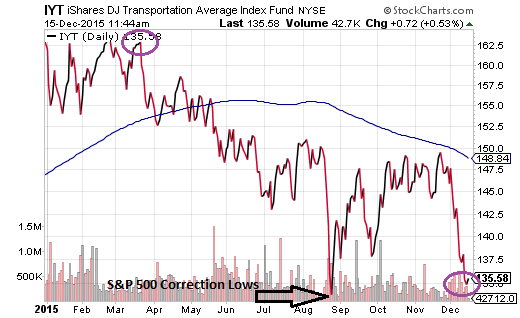
Maybe not. The iShares DJ Transportation Average (N:IYT) shows that investors see big troubles for American transportation corporations. The current price on IYT is near a 52-week low and sits approximately 10% below a long-term 200-day trendline. Equally troubling, IYT is trading near the lows of the August-September sell-off and it remains down 16.5% year-to-date.
The fact that lower energy prices are not providing the anticipated windfall to economic sectors that should benefit from lower oil prices continues to confound analysts and economists alike. For one thing, most of them have completely missed the cons of of commodity price depreciation; that is, gains for commodity users would be offset by losses for the producers (e.g., energy, materials, natural resources, etc.). Second, if the losses by the producers become bad enough, the number of resources-dependent exporters crimping global world product (GWP) can play into the notion of worldwide recessionary pressures. In other words, the U.S. is not an island; the well-being of the global economy matters more for risk taking in market-based securities than a simplistic assessment of oil savings benefiting retailers and/or transporters.
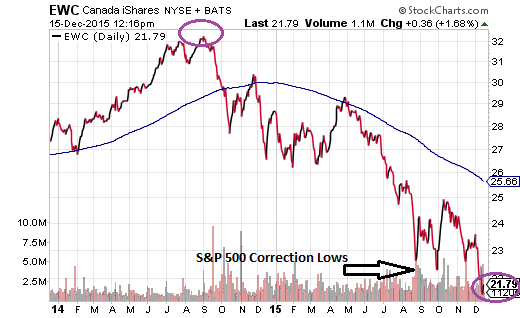
Just how bad do resource-dependent exporters have it? The second largest non-OPEC provider of oil to the world is Canada. The iShares Canada ETF (N:EWC) is in a bear market with price depreciation in the realm of 32%.
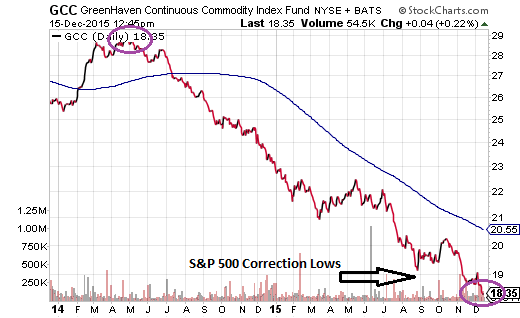
Myopic S&P 500 bulls dismiss the bear market in energy stocks and energy-dependent producers like Canada. Yet the problems extend far beyond the oil patch. There is a 46% bearish decline across the entire commodity complex via the GreenHaven Continuous Commodity Index Fund (N:GCC) due to weakening demand for “stuff” in the developing world and a surge in the U.S. dollar. When China, the world’s second largest economy and the world’s largest trader of goods witnesses year-over-year import declines of 18.8%, something’s not quite right.
Rapidly falling oil and commodity prices have hampered energy stocks, materials stocks and resources-dependent exporting countries. Yet investor trepidation has spread to other risk assets as well. The demise of appetite for high yield bonds in SPDR Barclays High Yield Bond ETF (N:JNK) has been blamed on everything from energy company debt woes to the collapse of the mutual fund, Third Avenue Focused Credit. However, an in-depth look at the high yield bond space shows that “Ex-Energy” high yield bonds have been diverging from the S&P 500 throughout the year. In other words, people want out of junk bonds because they are lowering their overall risk profile, not simply because of the asset class association with the beleaguered energy sector.
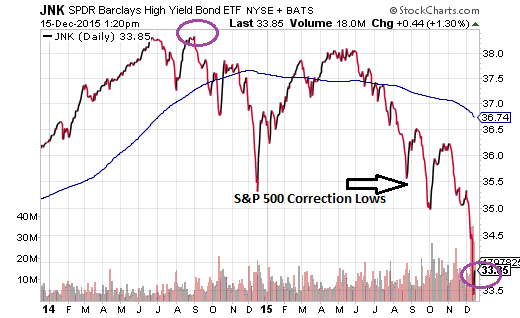
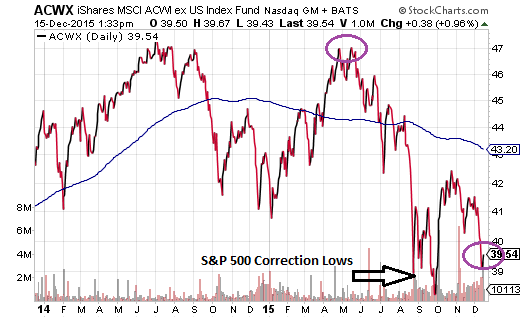
It is worth noting, then, that a wide range of risk assets are trading at prices that are in the same shape or in worse shape as they were back when the S&P 500 hit 52-week lows (1867). Energy stocks, retail stocks, transportation stocks, oil exporting countries, high yield bonds, commodities – each of these asset types are struggling mightily.
And that’s not all. The iShares All-World ex U.S. ETF (ACWX) is more or less constrained. Small-cap U.S. stocks via iShares Russell 2000 (N:IWM) are timid. In fact, both iShares MSCI ACWI ex US (O:ACWX) and IWM are below respective long-term moving averages and both are more than 10% off 52-week peaks set back in the first half of the year.
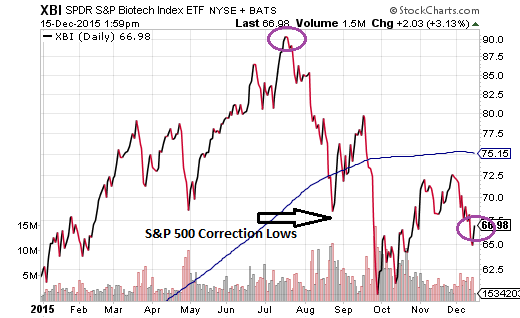
If risking one’s capital in non-U.S. stocks, small-cap U.S. stocks, high yield bonds, foreign bonds commodities, and a wide range of U.S. sectors (e.g., energy, materials, utilities, retail, transports, etc.) is proving detrimental, what’s left? Large-caps via the S&P 500 and the NASDAQ. Even here, though, some of the leadership in biotech names have yet to recover former glory. The S&P BioTech Index ETF (N:XBI) trades lower today that it did when the S&P 500 hit its 1867 bottom; it is 25% off its 2015 pinnacle and well below its long-term trendline.
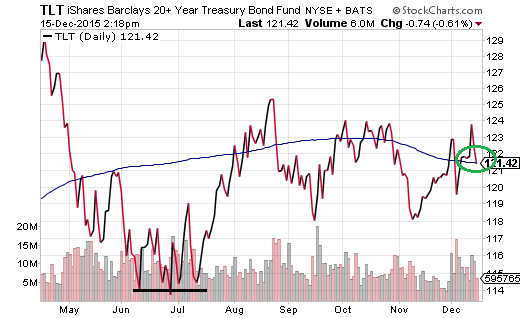
In sum, leadership across risk assets is so narrow, risking one’s capital in anything other than the large-cap indexes may not be worth it. Indeed, one may wish to keep in mind that while the S&P 500 has been resilient in 2015, it has remained below its May record (2134) for close to seven months. More resilient? Long-term Treasury bonds in the face of a Fed that intends to hike overnight lending rates. The iShares 20+ Year Treasury (iShares 20+ Year Treasury Bond (N:TLT)) is 5% higher than it was in the heat of July.
Disclosure: Gary Gordon, MS, CFP is the president of Pacific Park Financial, Inc., a Registered Investment Adviser with the SEC. Gary Gordon, Pacific Park Financial, Inc, and/or its clients may hold positions in the ETFs, mutual funds, and/or any investment asset mentioned above. The commentary does not constitute individualized investment advice. The opinions offered herein are not personalized recommendations to buy, sell or hold securities. At times, issuers of exchange-traded products compensate Pacific Park Financial, Inc. or its subsidiaries for advertising at the ETF Expert web site. ETF Expert content is created independently of any advertising relationships.
