As long as the US Stock rally continues to defy conventional wisdom of the majority - for example a bull market in stocks cannot coexist with a bear market in bonds, bearish calls (1, 2, 3) and pessimism towards them will only grow.
Small cap stocks (N:IWM), a key leadership group, has been lagging the broader market since 2006. This underperformance, even more pronounced since 2013, suggest not only steady deterioration in the domestic and global economies but also defines a highly focused - Dow Industrial and S&P 500 lead US stock rally. This is consistent will an evolving global debt crisis driven by safe haven capital flows from Europe and emerging market to the United States.
Investors, largely driven by emotions rather than discipline, tend to focus on volatility rather than the message of the market. This tendency prevents them from recognizing better opportunities in quieter markets.
Summary
The BEAR (Price) and BEAR (Leverage) trends under Q2 accumulation a seasonal high approaches position Russell 2000 (small cap stocks) as an aging bear opportunity.
Price
Interactive Charts: IWM, IWM PF
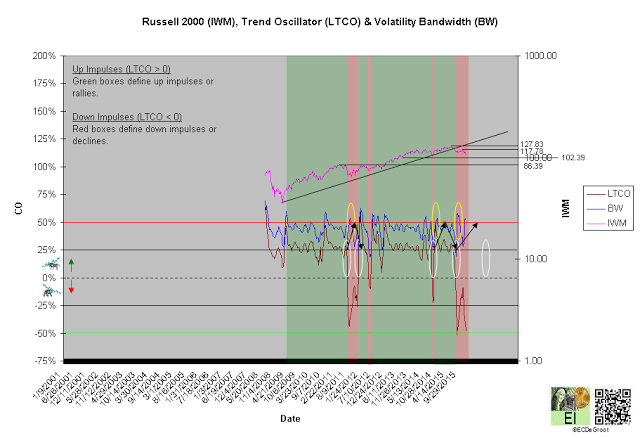
A negative long-term trend oscillator (LTCO) defines a down impulse from 115.01 to 103.85 since the third week of August (chart 1). The bears control the trend until reversed by a bullish crossover. Compression (white circles) within the CEC cycle generally anticipates this change.
A close above 107.48 jumps the creek and transitions the trend from mark down to cause. A close below 102.39 breaks the ice and maintains mark down.
Chart 1
Leverage
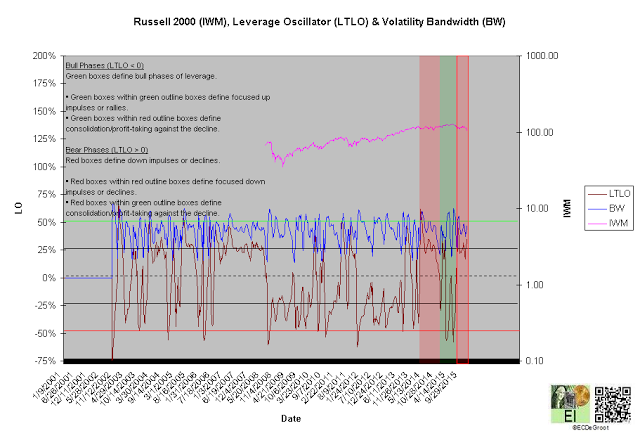
A positive long-term leverage oscillator (LTLO) defines a bear phase since the second week of August 2015 (chart 2). This focuses the down impulse (see price).
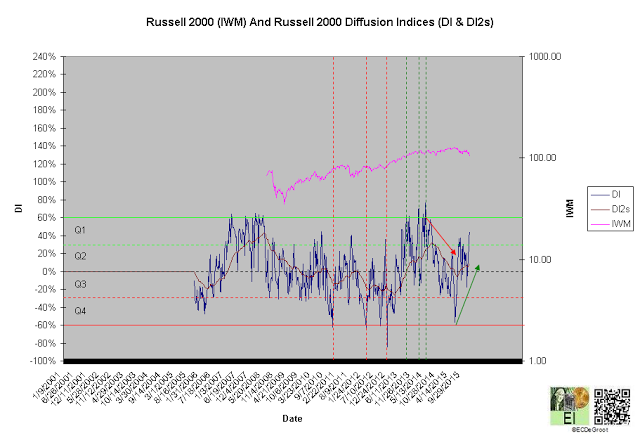
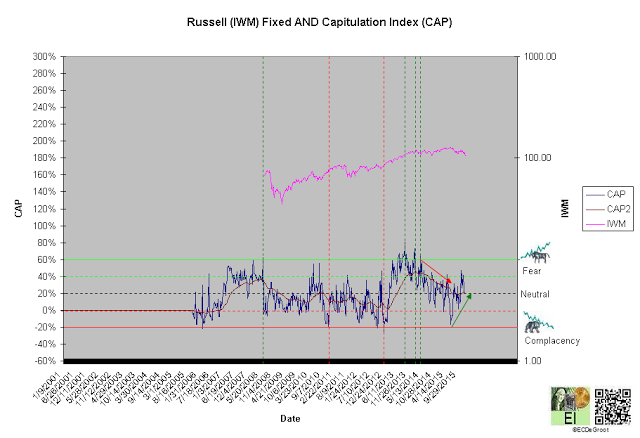
A diffusion index (DI) of 44% defines Q2 accumulation (chart 3). A capitulation index (CAP) of 22% supports this message (chart 4). DI and CAP's trends, broader flows of leverage and sentiment from distribution to accumulation and complacency to fear supporting the bears (green arrows), should not only continue to extreme concentrations but also restrain upside expectations until reversed (see price). Rally under these trends, a sign of strength (SOS) , would be bullish for small cap stocks longer-term.
Chart 2
Chart 3
Chart 4
Time/Cycle
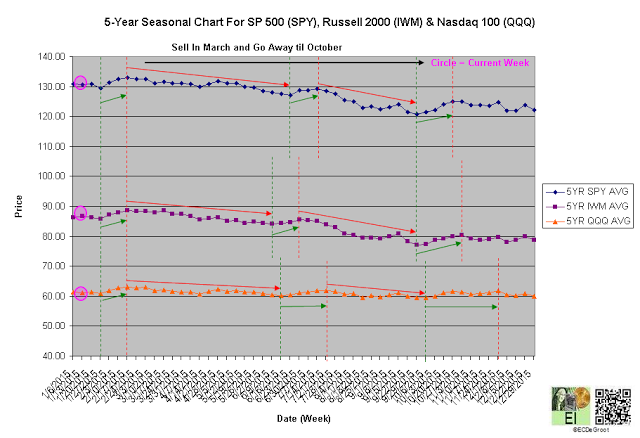
The 5-year seasonal cycle (purple series) defines weakness until the fourth week of January (chart 5). This seasonal path of least resistance restrains upside expectations over the short-term (see price).
Chart 5

