The Aussie and the Pound have been the main movers as markets factor in a less dovish-than-expected RBA and heightened risks of a collapse in the EU/UK trade negotiations. This is all happening under the umbrella of the coronavirus, which continues to dominate proceedings in order to set the tone in financial markets. Find out where we stand by keep reading...
Quick Take
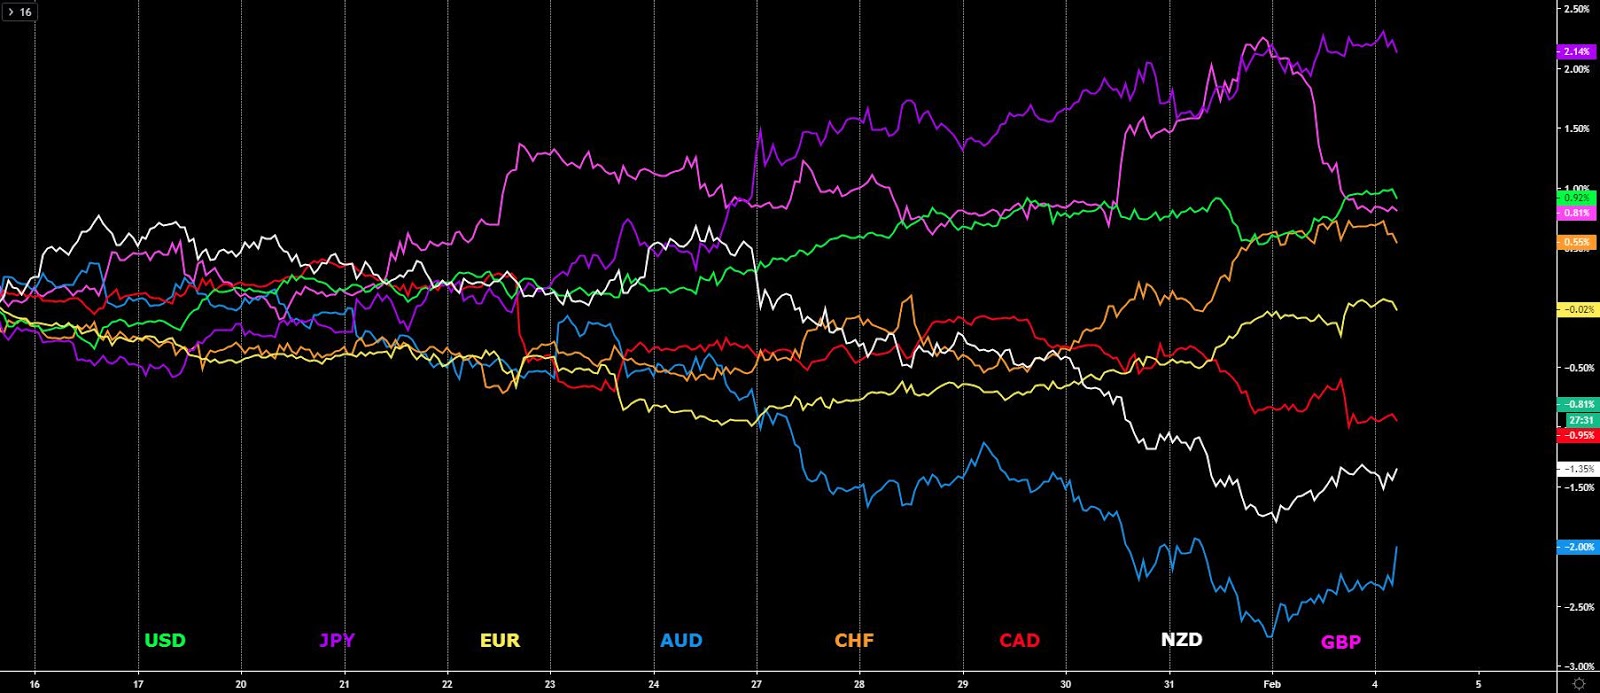
The market has gone through a short-term relief rally in risk-sensitive instruments. The modest easing of financial conditions as depicted by the rise in US equities or the pause in the bloodbath of global bond yields, has led to a minor recovery in the likes of the Aussie or Kiwi.
Interestingly, the bid in the yen or the US dollar puts into question this recovery as one that still communicates further trouble ahead, as does the fact that Oil or industrial metals keep losing ground. The Swiss Franc is also holding up its trend quite well as the index reflects. The resilience of the Euro is also quite impressive as buyers piled into Monday’s dip. The Canadian dollar saw follow-through supply with no particular fundamental catalyst, so my read on the fall is predicated on the fact that the CAD technicals remain very fragile. However, the main loser was the Sterling, with sellers in control of price from the open in Asia until the final hours of US.
What appears to be behind the latest sell-off in the currency is the anticipation that the negotiations between the EU and the UK on a trade deal may collapse unless either side stops playing ball and starts to provide a substantial number of concessions, which looks unlikely.
Narratives In Financial Markets
* The Information is gathered after scanning top publications including the FT, WSJ, Reuters, Bloomberg, ForexLive, Institutional Bank Research reports.
Risk-off eases a tad: The bid tone in risk instruments saw a tentative recovery with US equities having a solid day even if this still occurs in the context of a short-term bearish cycle and VIX finding a base at a worryingly elevated level of 18%, not a good sign. Meanwhile, the rebound off lows from US bond yields is nothing out of the ordinary as part of a market that has been sold off hard and needs some redistribution of orders. In both markets, the risk of further selling remains a not so distant prospect.
The S&P 500 rose by 0.77%, shrugging off the hard sell-off seen at the open of markets in China, where several commodity assets such as iron ore were limit-down. The more benign note in Monday’s risk profile allowed a mild upward adjustment in the valuation of the Aussie, although it should be a red flag that the Yen remains firmly bid, industrial metals such as iron ore or copper remain sold off or that Oil was down more than 2%.
The RBA announces no change in rates: The full text of the Statement by Philip Lowe, Governor of the RBA, on Monetary Policy, can be found here. Judging by the reaction in the AUD, the first interpretation of the statement was not as dovish as feared. Some of the key headlines included that the RBA will keep easing policy if needed to support sustainable growth, noting that rates are set to remain low for extended period, with the developments in labour markets to be monitored very closely. The RBA stated that low rates are boosting asset prices which should lead to increased spending.
The central scenario is for underlying inflation to be close to 2% in 2020 and 2021. On housing, the RBA sees signs of a turnaround in the housing market, especially in Sydney and Melbourne. On the bushfires and coronavirus, the RBA said will temporarily weigh on growth.
US ISM PMI returns above 50: The US ISM manufacturing survey came at 50.9 vs 48.5 expected. It is the first positive above-50 reading since July 2019. The details were quite strong too, with a substantial increase in new orders and export orders, although the coronavirus should tame the improved prospects. The remarks in the ISM manufacturing survey were more positive too. As an example, it was stated that "Business has picked up considerably” in the Computer & Electronic Products. This rebound was likely aided by the confirmation of the phase-one US-China trade deal.
GBP up the stairs, down the elevator: The Sterling saw a one-way traffic to the downside, with the fall it suffered going way beyond the currency’s average true range as the European Commission unveiled its draft mandate for upcoming negotiations with the UK. In the document, it was stated that "the future relationship with the UK will have to be based on a balance of rights and obligations and ensure a level playing field. The envisaged partnership is a single package that comprises general, economic and security arrangements." These rules to market access and regulatory alignment is where the UK government has drawn a line in the sand and where the risk of a breakdown in talks emanates from. The sell-off in the Pound suggests the market perceives a heightened risk of negotiations collapsing unless either side surrenders and starts to provide a substantial number of concessions. The stance by UK PM remains undeterred, noting “we will not engage in cutthroat race to the bottom on trade.”
US-China to hit an impasse on trade deal? Another source of attention by the market is the news that China is said to be seeking US flexibility on Phase 1 trade pledges, citing people familiar. This should not be underestimated as it carries the clear risk of Trump putting pressure on China to meet its end of the deal at a very sensitive time where the Chinese economy is set to slow down. Once the agreement takes effect by mid-February, there is a clause attached to it where "in the event that a natural disaster or other unforeseeable event" delays either side from complying, the US and China will consult to find a mutual understanding. According to Politico, observers note that "If the bilateral trade deficit is not falling, Trump won't care about the Chinese and their excuses," the report says. The demands for the US to show a more lax approach to the trade conditions follow reports that Chinese officials are evaluating a decrease in the targeted economic growth this year to “around 6%” from 6-6.5% in 2019, which to me, still looks hugely ambitious given that the slowdown in economic activity due to the coronavirus seems to still have a lot more to play out.
Where we stand in the Coronavirus situation? It’s worth reminding the reader that a new research paper on the coronavirus, published by the reputable site Lancet, found that the Wuhan coronavirus cases were at 75,800 as of Jan 25, concluding that “epidemics are already growing exponentially in multiple major cities of China with a lag time behind the Wuhan outbreak of about 1–2 weeks.” It also states that “Large cities overseas with close transport links to China could also become outbreak epicentres.” I also urged the readership yesterday to watch this video by Dr Gabriel Leung, Dean of Medicine at the HK University, who discusses the prospects for containment, timing of the peak and other key points. It’s the most objective and educated assessment I’ve seen. It should be a major warning when you see many airlines suspend flights in and out of China, with bans set to stay in place until the end of March at least. This story cements the risk of prolonged risk aversion. Lastly, on a more positive note, a study by The New England Journal of Medicine (NEJM) on Jan 30 claiming that the new coronavirus can be transmitted by people without symptoms, which was a very troublesome situation as it would make it much harder to contain the spread, is being refuted as flawed, according to the Science Magazine.
Warning by Rabobank on the ramifications of the Coronavirus: The Rabobank Research Team notes that the type of market sell-off we’ve seen “Imparts a natural tendency on the part of our not-so-natural markets for aggressive dip-buying. However, as opposed to the headline of “World War Three!” which triggered a bout of risk-off action at the start of the year, this sell-off appears far more justified. The same op-ed writers who did not understand the real-politick of the Soleimani assassination and were wrongly screaming “Sell!” after that event are today trying the argument that “More people die from slipping in the shower, etc., than this Coronavirus.” This overlooks the fact that this virus has the potential to go exponential and become a global pandemic. It’s a small risk, yes - but it’s a FAAAAAAAT tail risk, that tens of millions of people simultaneously slipping in the shower really isn’t. Indeed, it’s the kind of huge risk that doesn’t just put you out of your portfolio position, or out of business, but out of the game, full-stop. Markets are quite right to react in a strongly negative, preventative fashion to this risk until we see evidence that it is being brought under control and the threat has truly passed. And we are not there yet, very regrettably. When we are, we see the real bounce. In short, “panic measures” are not always a sign of panic – they can be rational.”
Iowa Democrat Caucus eyed: In US politics, the focus is clearly on the Iowa Democrat caucus which takes place through the Asian session and where Bernie Sanders remains the favourite to take Iowa and stats suggests that he’s become the front runner to take the Democrat Nominee. While Iowa is a relatively small state that allocates just 1% of the delegates candidates earn on their way to the nomination, as Business Insider notes, “it holds disproportionate significance in the process as it’s the first state to cast its ballots for the presidential nomination.” Of statistical relevance is the fact that “the eventual Democratic nominee won the Iowa caucuses in six out of the past eight competitive Democratic presidential primaries” BI added.
Insights Into FX Index Charts
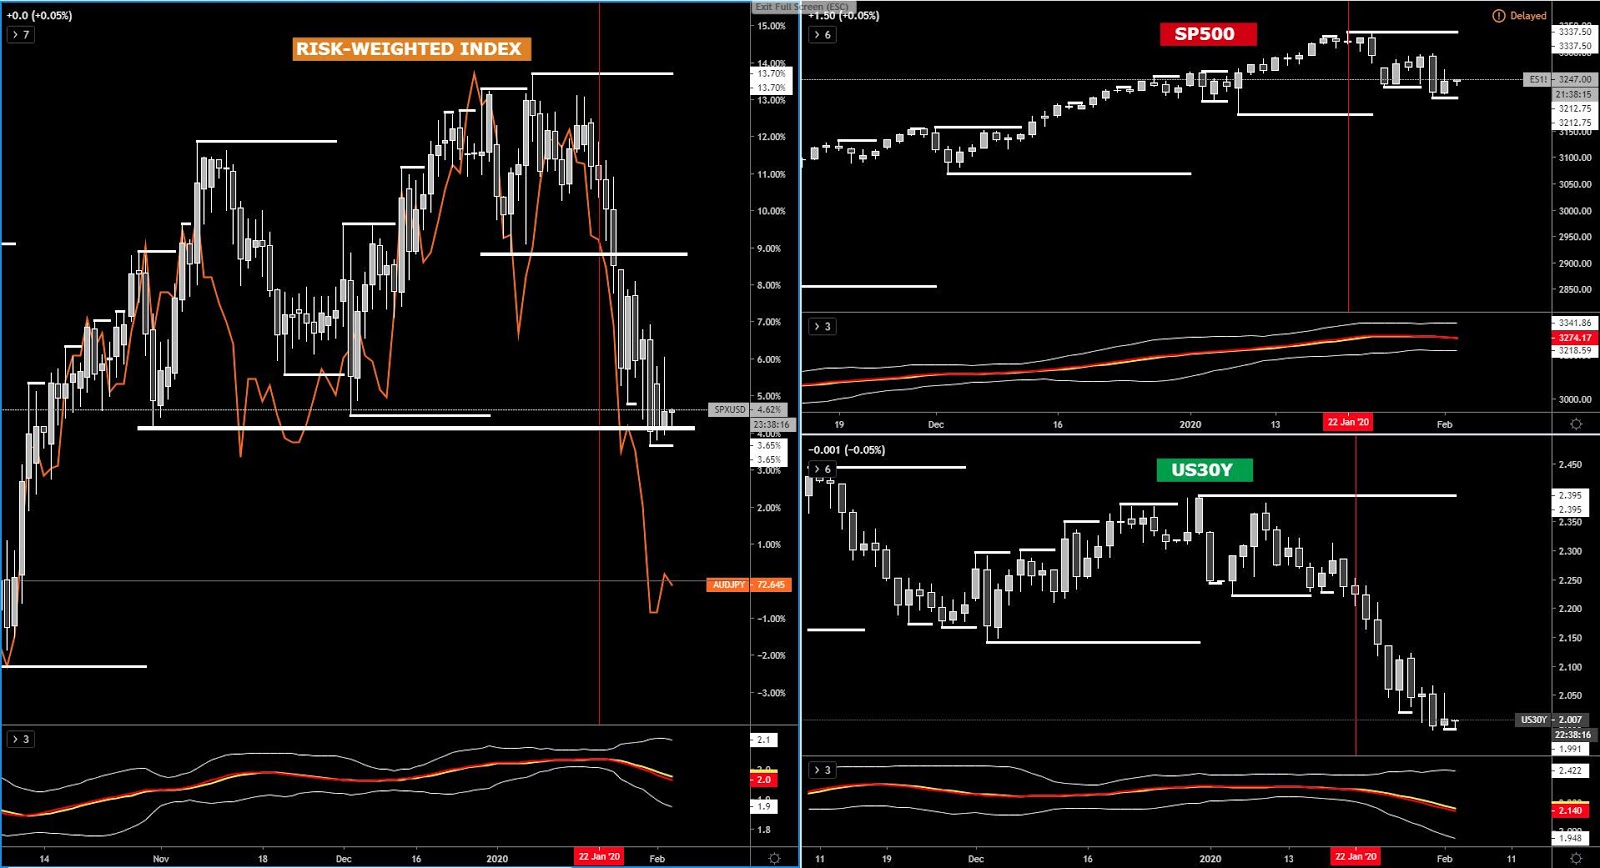
In the grand scheme of things, the risk dynamics have improved ever so slightly at a key intersection point (support) in the hybrid risk-weighted index that accounts for the S&P 500 and US30y bond yields applying a formula to harmonize the volatility. The red vertical line depicts the moment that the coronavirus headlines picked up on Jan 22. The bear trend that has occured as a consequence of this news igniting uncertainty is clearly visible, with the orange line tracking the performance of the AUD/JPY spot as another true barometer of risk conditions. The chart aims to reinforce the notion that we are far from being out of the woods in this coronavirus saga, as both the smart money tracker and the price structure has turned bearish near term. For the brave souls out there, it must be acknowledged that the area where the risk-weighted index price has landed at is a very attractive location to potentially attract buy-side pressure though.
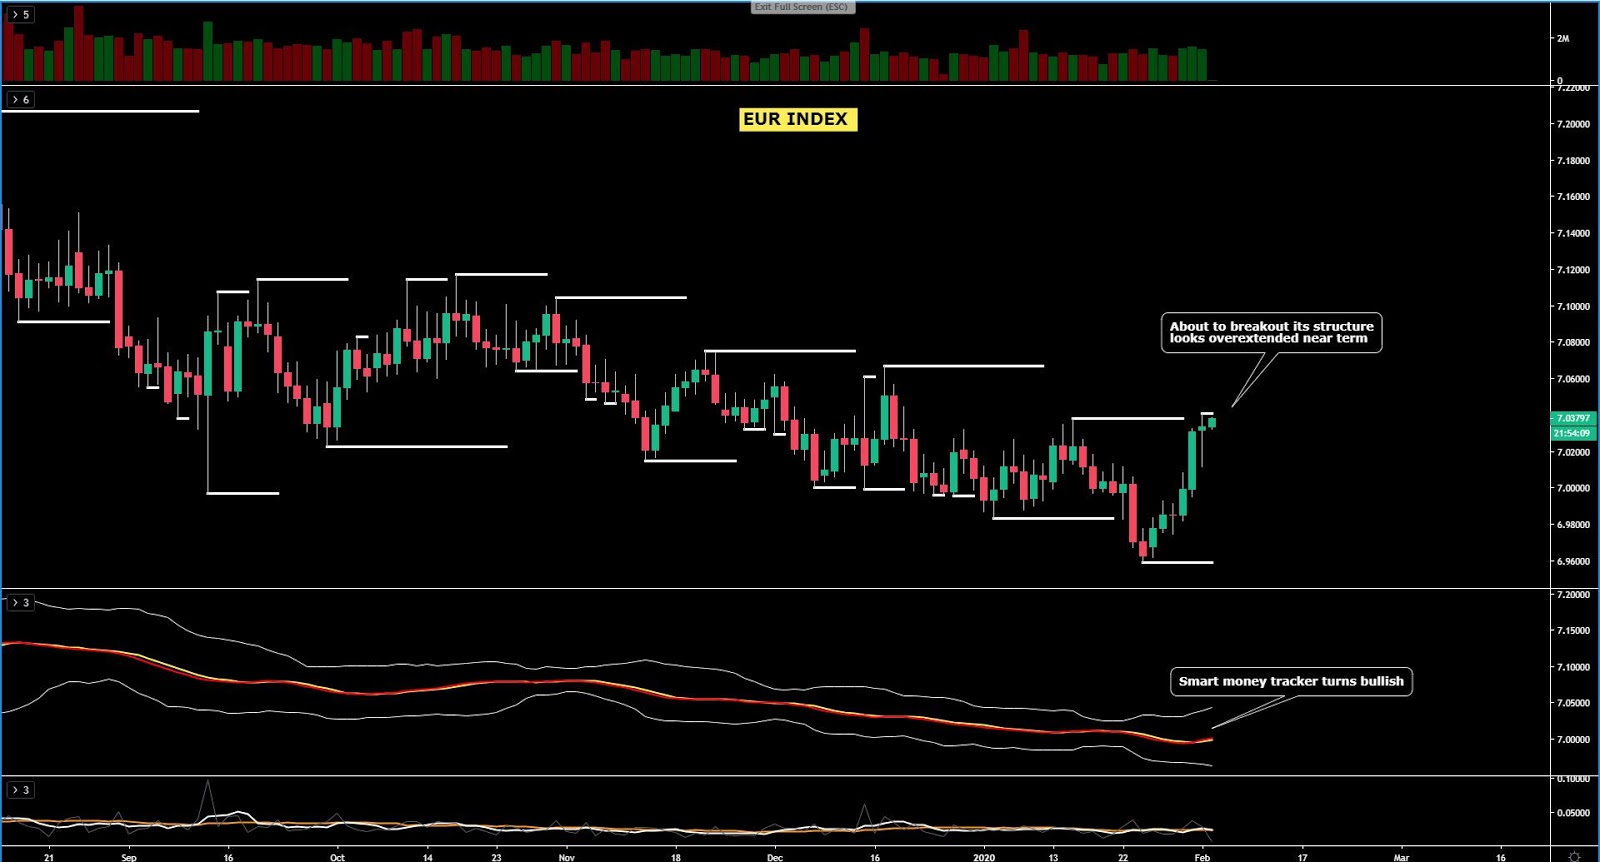
The EUR index found strong buying interest on the early weakness seen, to the point that the index finds itself now at the brink of a breakout of structure, an event that would represent a reaffirmation of the bullish stance. While I wouldn’t be surprised in the slightest that the resistance overhead acts as a rotational point back towards a mean measure, the sizeable lower shadow print on Monday cements the notion of buy-side pressure still in dominance. Besides, this is backed up by the turn higher in the smart money tracker, but as I said, it needs to be accompanied by a breakout of a price structure, which may be just 24h away.
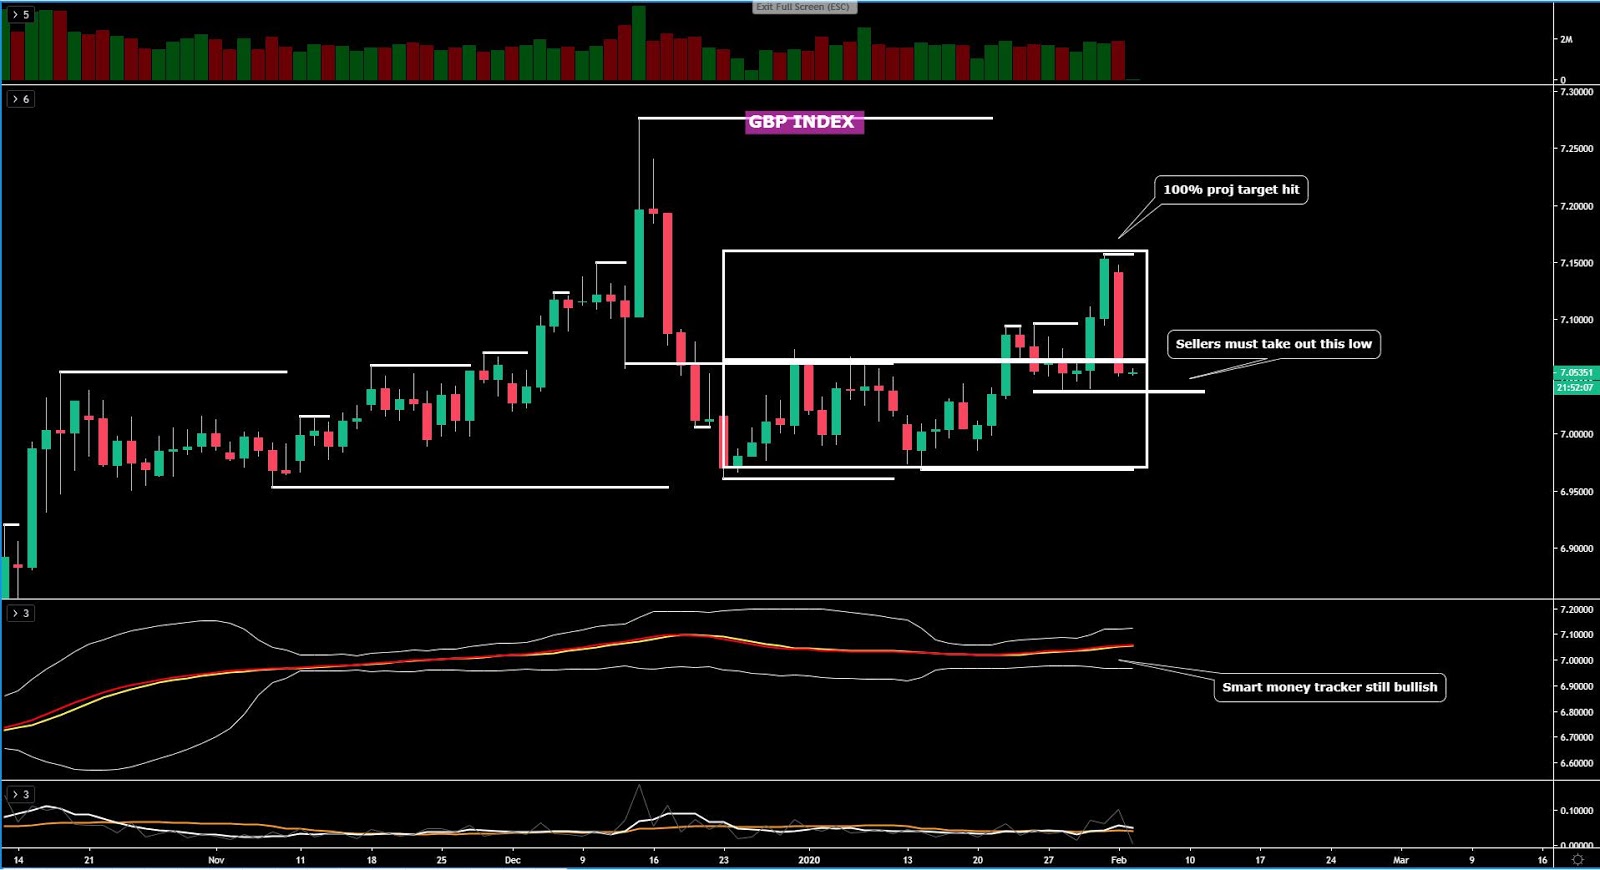
The GBP index, after it reached its 100% projection target, has seen a major setback that puts the bullish arguments in question. While it still cannot be confirmed that a full-fledged transition to a bearish market has ensued, the close of Monday’s sizable candle shows very limited interest to be a buyer. What needs to happen to gain conviction in the establishment of a bearish cycle is the breakout of the prior swing low alongside the slope in the money tracker turning south. Only then, this would become a market where I am inclined to sell strength. Until then, the prospects, especially after such an oversized movement, are not as clear cut.
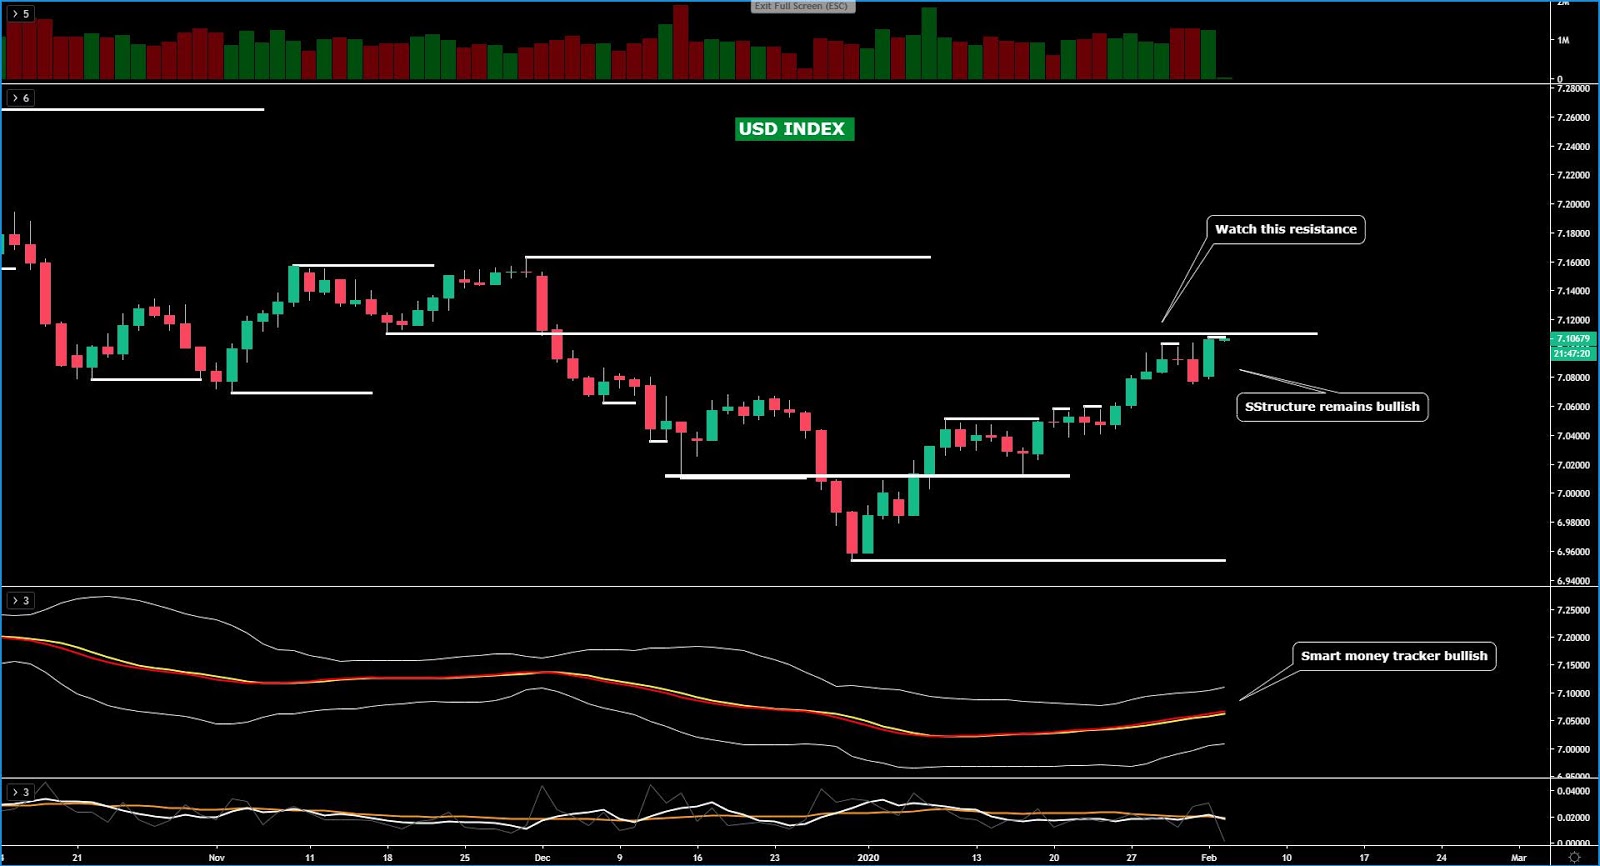
The USD index is revisiting an inflection point in the form of a resistance area, which uses as reference the swing lo from Nov 19 last year. A break of this high would be incredibly bullish for the currency and would open the doors for a possible extension towards the double top seen through Nv last year. However, note that this resistance can also act as a location for price to pullback from in what I’d still perceive as simply a correctional move in nature in the context of a bullish market that with the backing of the smart money tracker slope and the price structure.
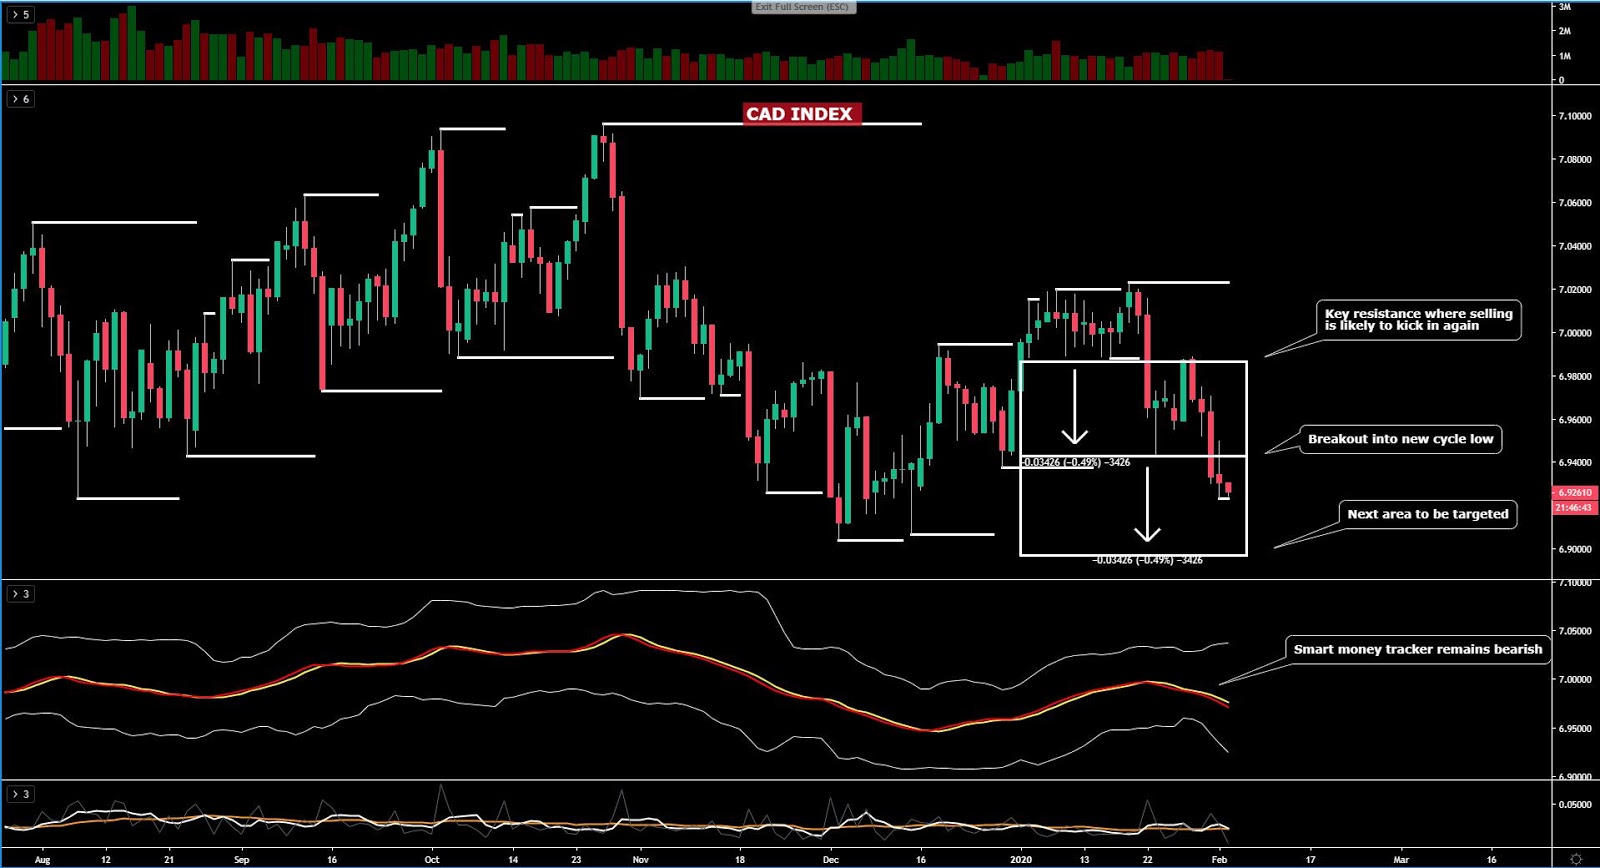
The CAD index keeps respecting the bearish script endorsed as part of my daily analysis. After the index found further follow through continuation to vindicate the formation of yet another bearish cycle, the risk is now clearly skewed towards a fall to the tune of 0.5% from the breakout point seen last Friday until the next 100% projection target is met. The bearish sentiment on the basis of a more dovish BOC and overall risk-off dynamics sees the blending of technical confirmation to keep suggesting the path of least resistance continues to be lower.
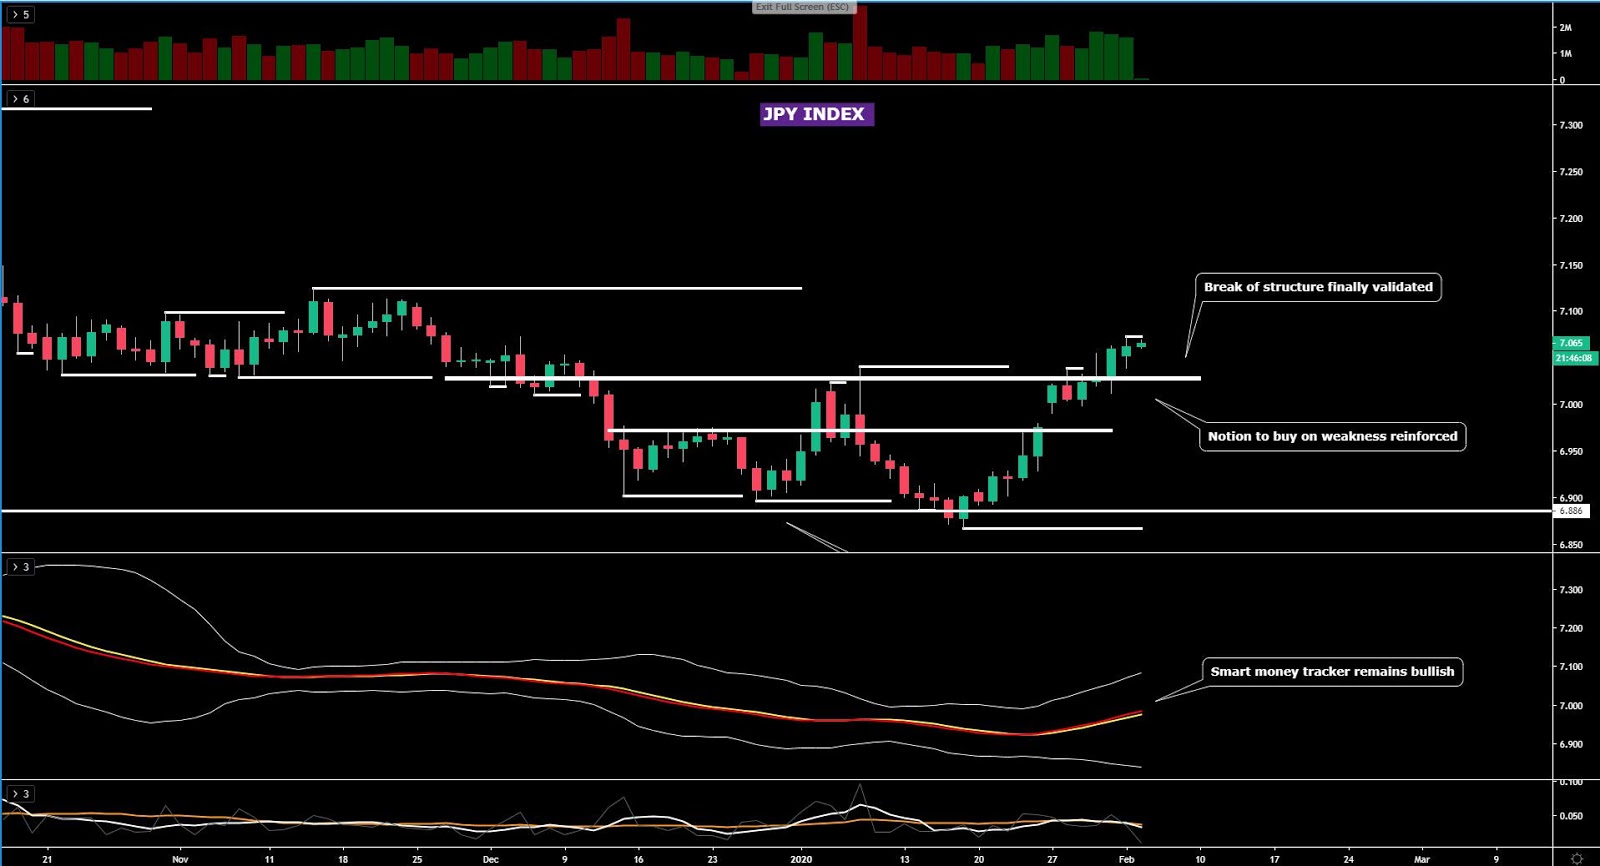
The JPY index has cemented its bullish outlook from a price structure point of view by finding further buying interest above a critical level of horizontal resistance. It remains my base case that the coronavirus will keep the Yen bought up at regular intervals with the more conviction now that the price structure is in alignment with the smart money tracker. The breakout and acceptance above the previous swing high from early 2020 hints at buy on dips as default view.
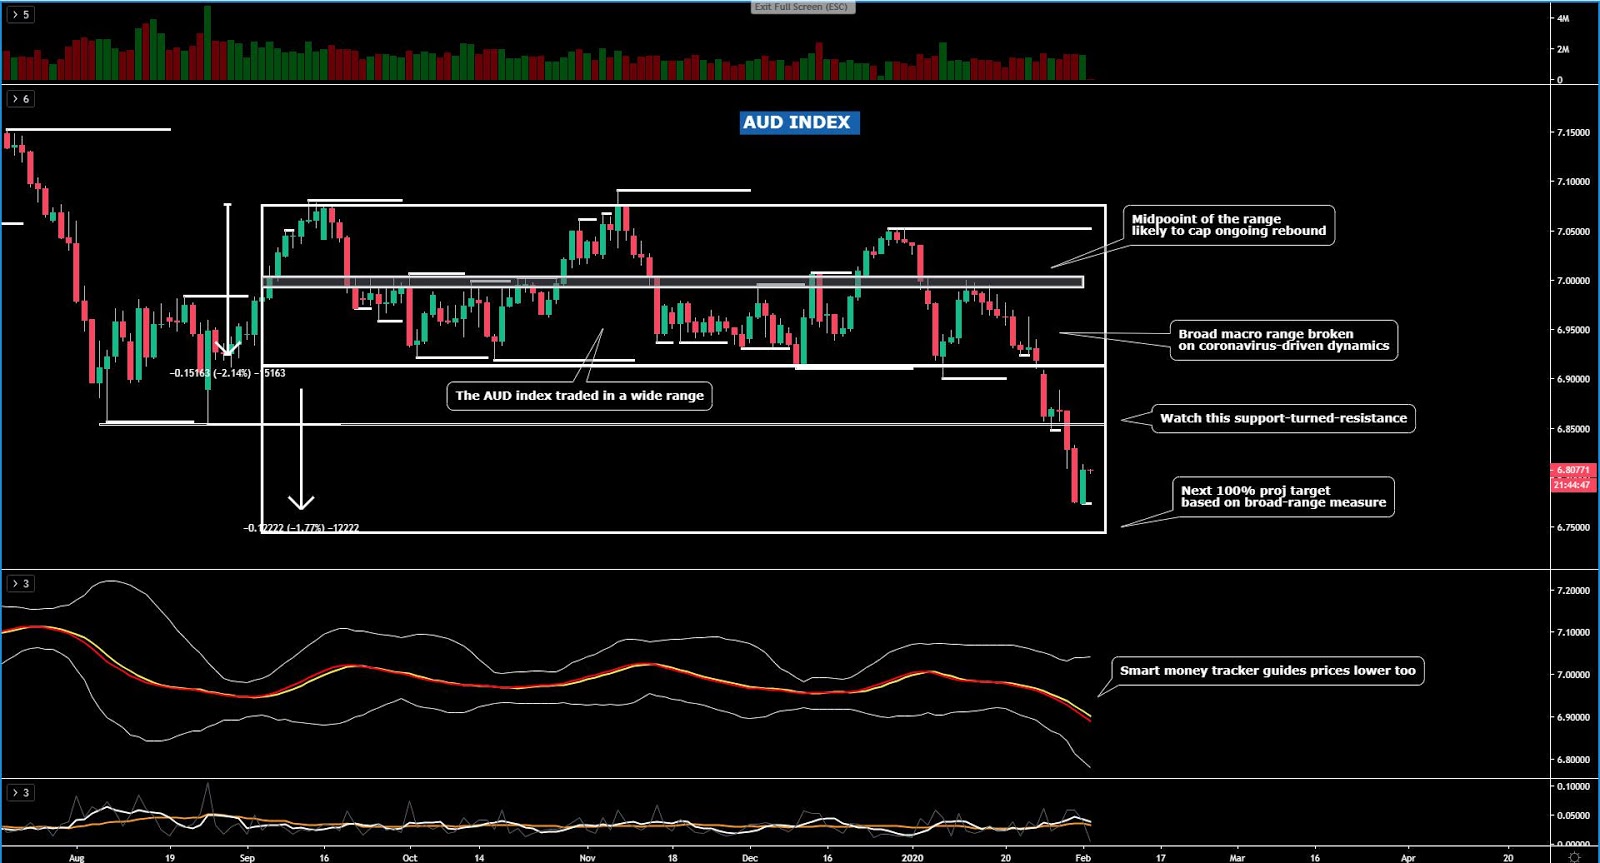
The AUD index managed to see some tepid rebound off the lows even if the outlook remains well anchored towards further downside until a macro 100% projected area where I’d expect the currency to pause its downward value suppression. This macro 100% projection is based off the broad range broken on January 27th. This means that my base case continues to be an Aussie that remains under pressure for an additional 0.4%-0.5%. As I mentioned on Monday, the Aussie trades very overextended, so for scalping purposes it’s a market to still capitalize on the short-side, but if you are looking for value trading, stay away from AUD shorts until there is a considerable rebound towards areas of technical significance.
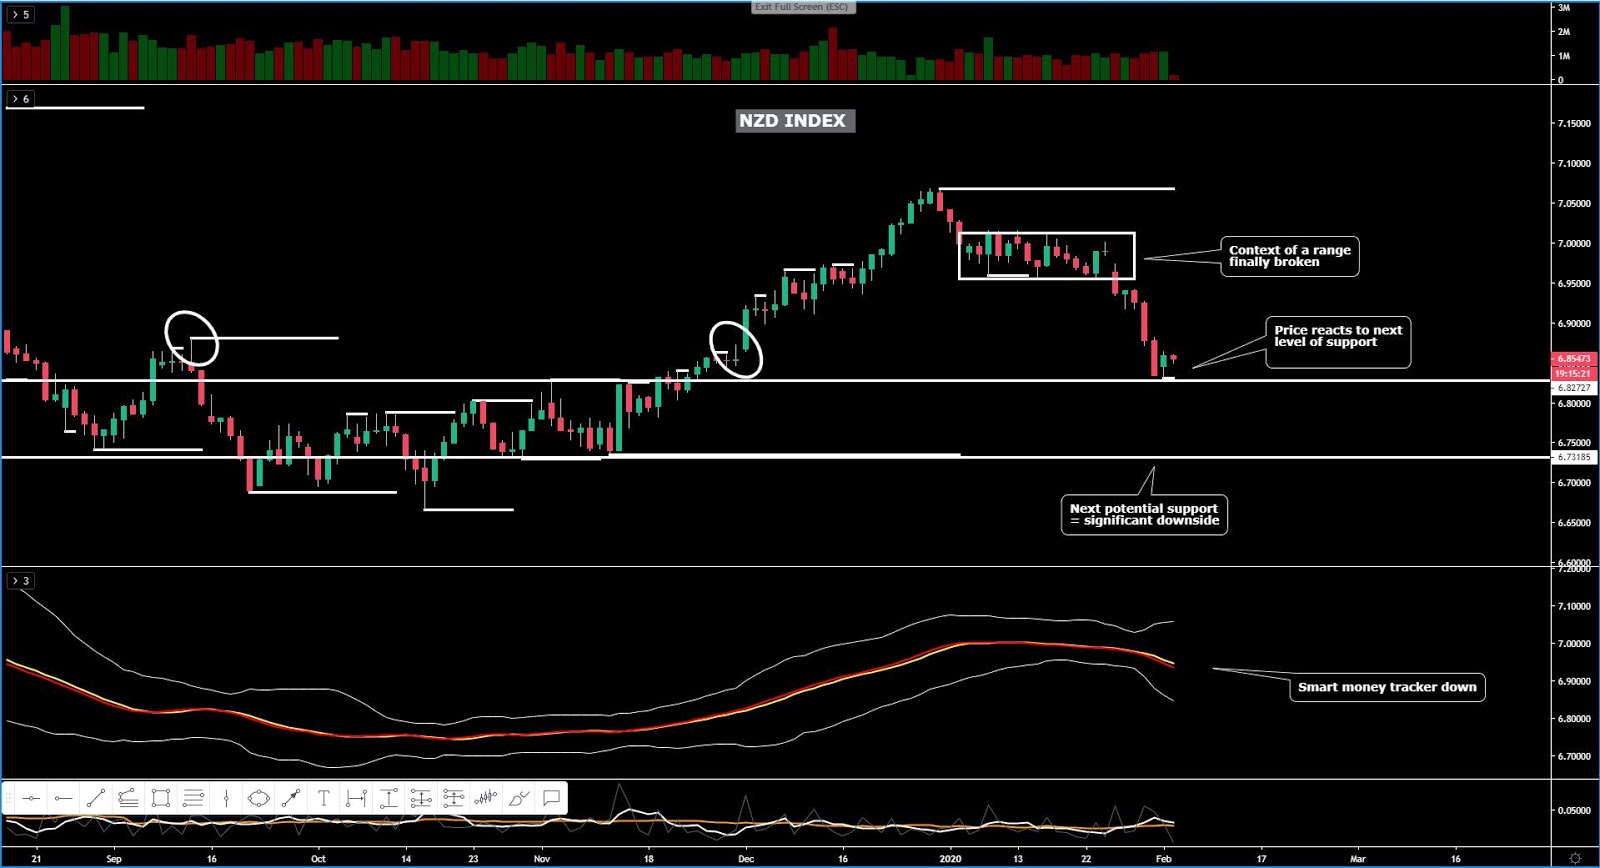
The NZD index has extended its sell-off until finding another line of strong support. The market sentiment continues to depress the interest to hold NZD long exposure and with good reason but this location is definitely an interesting spot to see the bleed lower pause. The technicals are outright bearish but whenever confronted with such a support, caution is warranted. If the level gives, more downside is in store for the Kiwi, while if risk appetite returns, this is a phenomenal spot to start building NZD longs, even if at this point the risk such idea carries remains high.
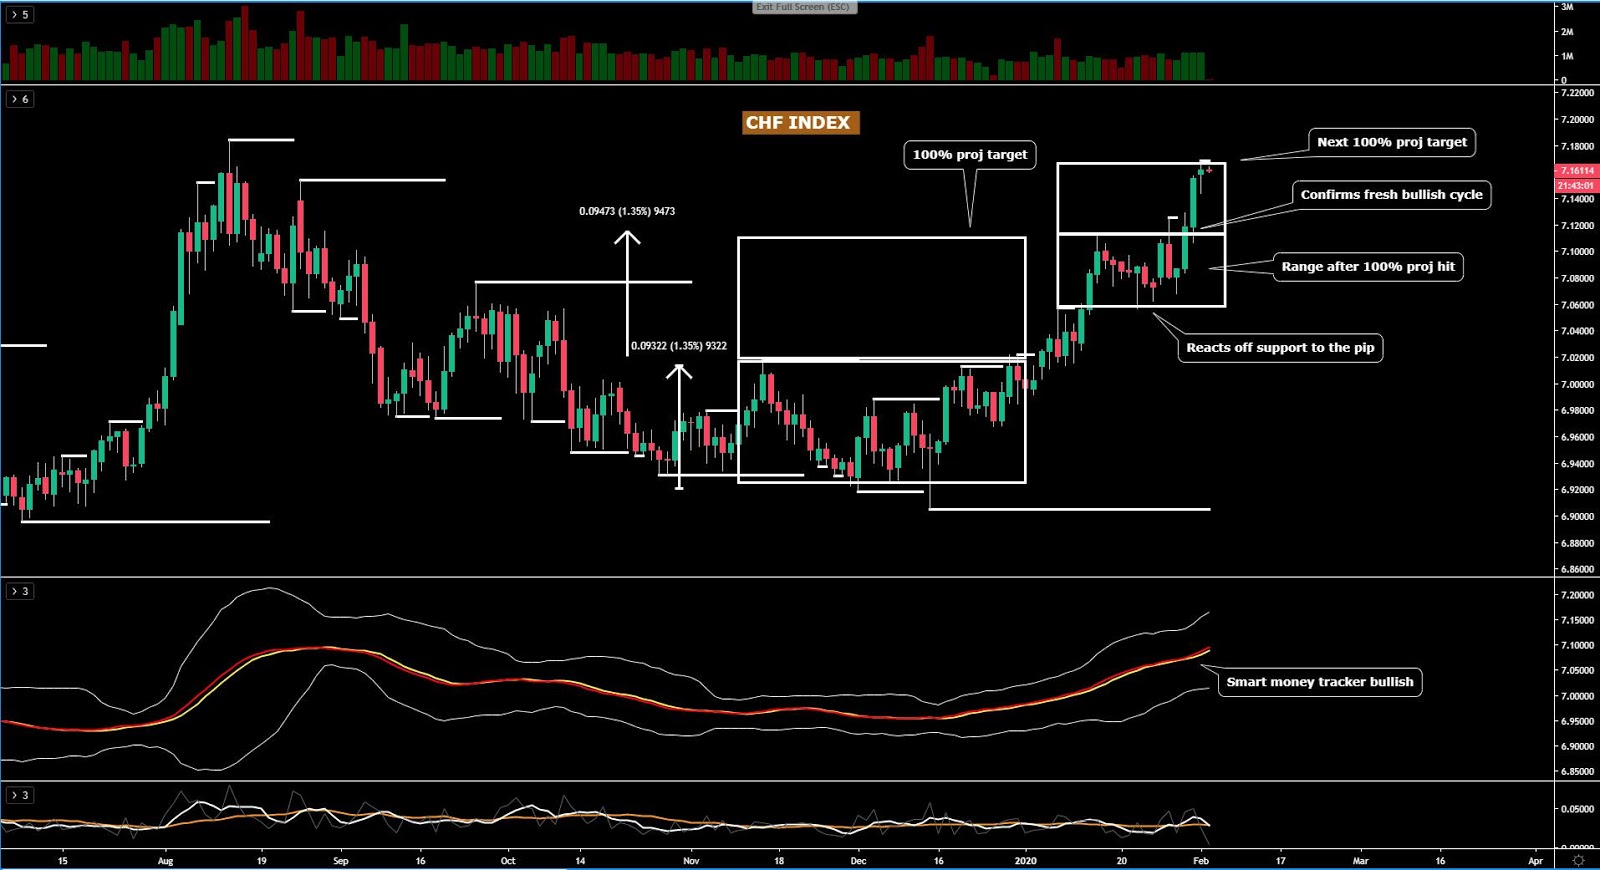
The CHF index, after breaking its 2-week consolidation phase and finally accepting level outside these range parameters last Friday, extended towards its 100% measured movement, hence in the short-term, a setback of sorts in the price of the CHF may be expected. As in the case of any overextended market, even if the bullish momentum continues, this is not a market fitting most accounts outside intraday long scalping. You’d be better off waiting patiently for a correction in price into levels of technical significance outside overbought readings.
Important Footnotes
- Market structure: Markets evolve in cycles followed by a period of distribution and/or accumulation.
- Horizontal Support/Resistance: Unlike levels of dynamic support or resistance or more subjective measurements such as Fibonacci retracements, pivot points, trendlines, or other forms of reactive areas, the horizontal lines of support and resistance are universal concepts used by the majority of market participants. It, therefore, makes the areas the most widely followed and relevant to monitor.
- Fundamentals: It’s important to highlight that the daily market outlook provided in this report is subject to the impact of the fundamental news. Any unexpected news may cause the price to behave erratically in the short term.
- Projection Targets: The usefulness of the 100% projection resides in the symmetry and harmonic relationships of market cycles. By drawing a 100% projection, you can anticipate the area in the chart where some type of pause and potential reversals in price is likely to occur, due to 1. The side in control of the cycle takes profits 2. Counter-trend positions are added by contrarian players 3. These are price points where limit orders are set by market-makers.
