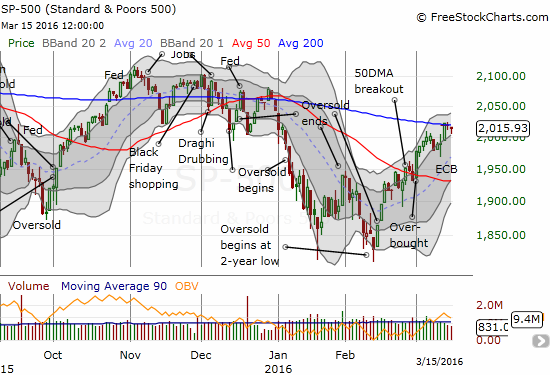
What a difference a month makes.
On February 19, the S&P 500 (SPDR S&P 500 (NYSE:SPY)) was taking a brief rest from a sprint off oversold conditions. The market for Fed Fund Futures had priced away any rate hikes for all of 2016. Ever since then, expectations have risen ever higher. NOW, the market expects the next rate hike as early as July and June carries 48.2% odds.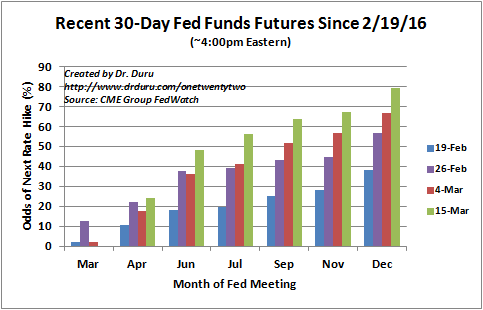
The market is suddenly very optimistic about imminent rate hikes.
I have assumed the market would acutely respond to changes in expectations for rate hikes. However, none of the standard reactions have played out. The S&P 500 (SPY) has been able to rally before getting stalled at a critical juncture with resistance at its 200-day moving average (DMA). SPDR Gold Shares (NYSE:GLD) is barely off recent highs and trades exactly where it was on February 19th. Like GLD, the U.S. dollar index (DXY0) is also trading exactly where it sat on February 19th. Only iShares 20+ Year Treasury Bond (NYSE:TLT) is “behaving” with a small decline over the past month.
The S&P 500 is struggling at 200DMA resistance.
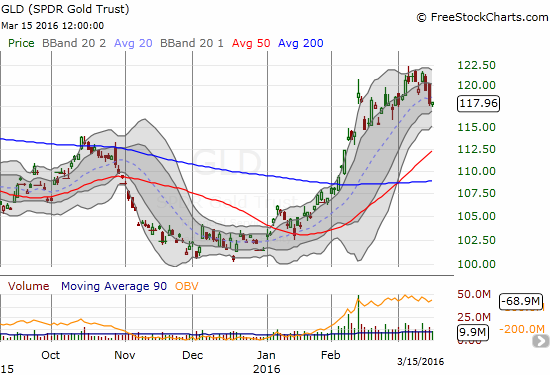
GLD is keeping its chin up by trading just off recent highs.
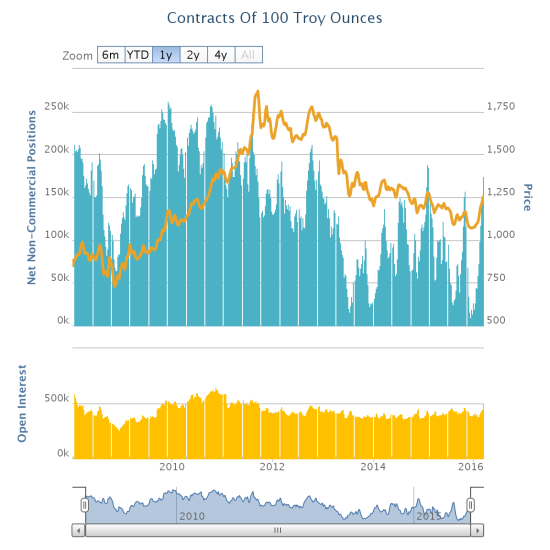
Speculators continue to ramp up net longs in gold.
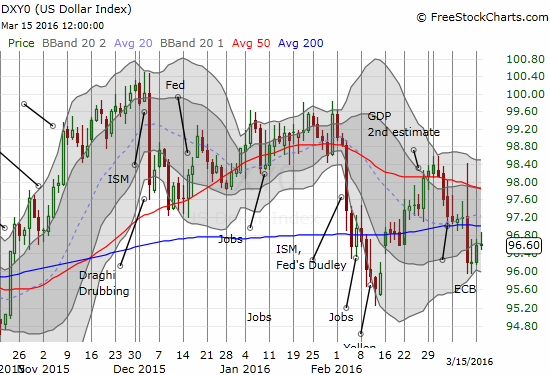
The U.S. dollar index has failed to benefit from rising rate expectations. The index is still flirting with a 200DMA breakdown.
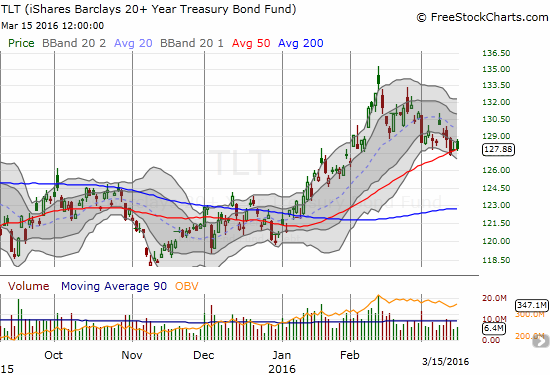
The iShares 20+ Year Treasury Bond (TLT) is trying to hold support at its 50DMA
These pictures suggest that “policy divergence” no longer rings bells in the market. These pictures also make me even more hesitant that usual to try to anticipate what the Fed’s next move will bring. I am just bracing myself.
Speaking of bracing myself…grinding away in the background of this seemingly endless game of monetary policy with the Federal Reserve is a potentially important divergence in market participation. A friend of mine brought a Bloomberg article to my attention titled “There’s Only One Buyer Keeping S&P 500’s Bull Market Alive.” The article presents a stark contrast between market participation of corporations and mutual fund investors. Fund flows show a slow and steady withdrawal of interest in the stock market from the heady days of 2000. The waning participation turned into outright abandonment just ahead of the financial crisis. I have pointed out in a much earlier piece how I was impressed with this seeming prescient behavior by what is typically called the “dumb money.” Meanwhile, some of the “smart money” accelerated investment in the market through buybacks all the way into the 2007 peak on the S&P 500. Companies went back to work when the market hit bottom in 2009. The buybacks have increased on a near steady uptrend since then.
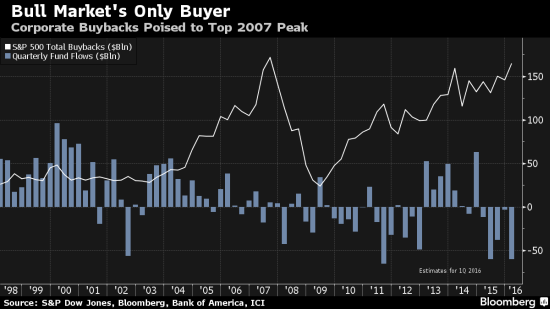
Buybacks and fund flows are trending in sharply different directions!
The article does not consider whether the decline in fund flows represents the pursuit of alternative market investments like ETFs. However, I doubt the rising popularity of ETFs have much to do with the declining trend in fund flows given the burst of buying that happened during the heady times of 2013 and early 2014 when the S&P 500 started logging a series of new all-time highs. The fund flows have gone deeply negative the past three of four quarters in a move that could be related to fears of what the Fed’s tightening might do the health of the stock market.
While a tidy explanation may not present itself, I cannot help but stay on alert seeing this contrast. Are the exits from funds signalling an imminent great sell-off again? If the market manages to break out, will fund flows sharply reverse to the positive as folks chase the rally? If companies push right past 2007’s buyback levels, will they manage to provide a new spark for the market? Time will tell…
Be careful out there!
Full disclosure: long GLD, long TLT call options

