T2108 Status: 85.7%
T2107 Status: 37.8% (new 7-month high)
VIX Status: 16.5
General (Short-term) Trading Call: cautiously bullish (see caveats below)
Active T2108 periods: Day #21 over 20%, Day #20 over 30%, Day #17 over 40%, Day #14 over 50%, Day #10 over 60%, Day #9 over 70%, Day #7 over 80% (overbought)
Commentary
Sometimes what determines the health of a trend is not the immediate momentum but the capacity for coming back from a setback. In the last T2108 Update, I described how the market suffered a rare setback rare for this post-oversold bounce. On Friday, March 11th, the stock market came back strong.
T2108, the percentage of stocks trading above their respective 40-day moving averages (DMAs) closed near its 4-year high, and the S&P 500 (NYSE:SPY) surged right to critical resistance at its 200-DMA. The index is closing in on a flat year-to-date performance.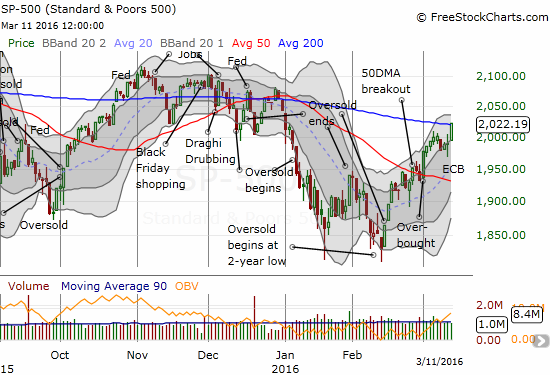
The S&P 500 (NYSE:SPY) jumps right to resistance as buyers flirt with a major breakout.
Normally, I would start talking about the high odds of a setback given overbought conditions at such a critical line of resistance. However, T2107, the percentage of stocks trading above their respective 200-DMAs, jumped to a fresh 7-month high. As I have stated earlier, T2108 is so high and so deep into overbought territory that I must use T2107 to verify the health of the stock market. (I will wave a yellow flag if T2108 falters notably).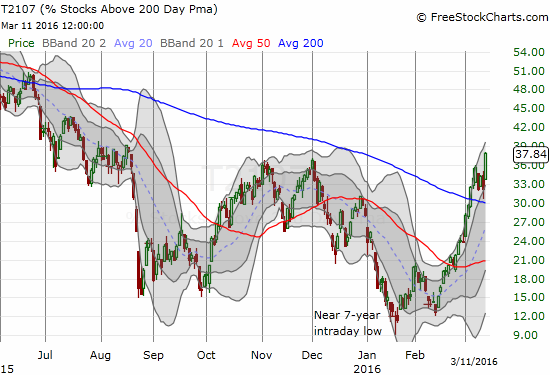
T2107 resumes its upward momentum alongside the S&P 500.
The fresh burst of buying also pushed the volatility index, the VIX, ever closer to the 15.35 pivot. This move essentially renders unattractive the risk/reward balance for fading volatility ahead of this week’s Fed meeting. I wanted to wait until the meeting was a day or two away. The market either is getting in on this trade earlier and earlier and/or the latest liquidity pump of the European Central Bank (ECB) had some kind of 1-day delay in delivering more courage to buyers.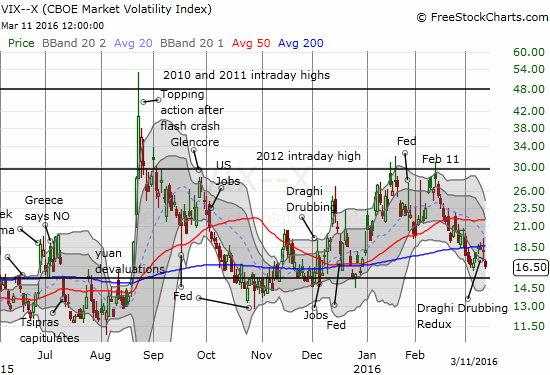
The volatility index tumbles from its 200-DMA and looks ready to return to the 15.35 pivot.
The Australian dollar (FXA) versus the Japanese yen (FXY) also confirmed bullishness with another burst higher. Like the S&P 500, AUD/JPY is testing 200DMA resistance. The currency pair has remained capped by this resistance since June, 2015. Simulatenous to a 200DMA breakout, AUD/JPY has the opportunity to hurtle resistance from the January, 2016 highs for what could be a very bullish double breakout. I add one more small increment to my AUD/JPY short as a hedge. Going forward, if AUD/JPY breakouts, I will focus a lot more on aggressively trading long Aussie and short yen positions.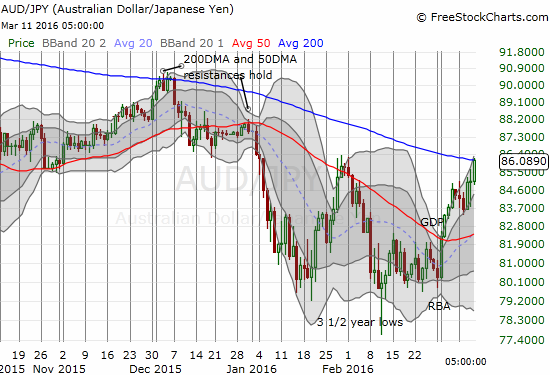
AUD/JPY surged into critical resistance at its 200-DMA.
With a Fed meeting coming up, I will refrain from reading too much into the charts of individual stocks. However, I DO want to point out Amazon.com (NASDAQ:AMZN). The stock is neatly wedged between 200DMA support and 50DMA resistance. I got a little ahead of myself on Friday by buying a call option to anticipate a breakout. Such a move could prove quite powerful. Similarly, if AMZN breaks down below its 200DMA support, an extended period of selling could resume. A potential Bollinger Band (BB) squeeze is adding to the growing drama. AMZN will be forced to make a move one way or the other, but I am also bracing for the first break to deliver the false signal before a reversal into the true break.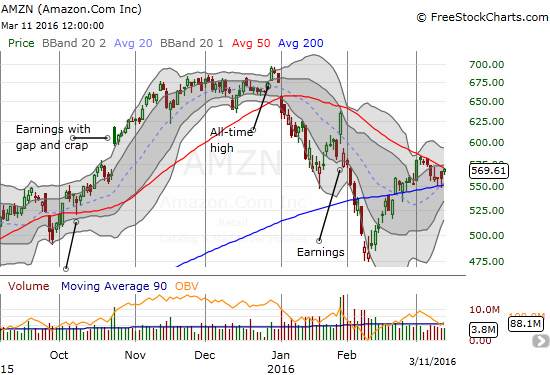
Amazon.com (NASDAQ:AMZN) is positioned for a major move – up or down.
For readers interested in reviewing my trading rules for an oversold T2108, please see my post in the wake of the August Angst, “How To Profit From An EPIC Oversold Period“, and/or review my T2108 Resource Page.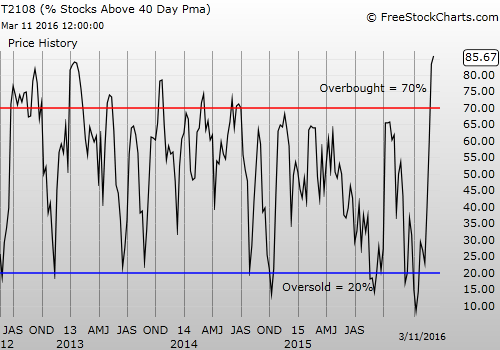
Black line: T2108 (measured on the right); Green line: S&P 500 (for comparative purposes)
Red line: T2108 Overbought (70%); Blue line: T2108 Oversold (20%)
*All charts created usin
Be careful out there!
Full disclosure: short FB, long FB call options, long CAT put options
