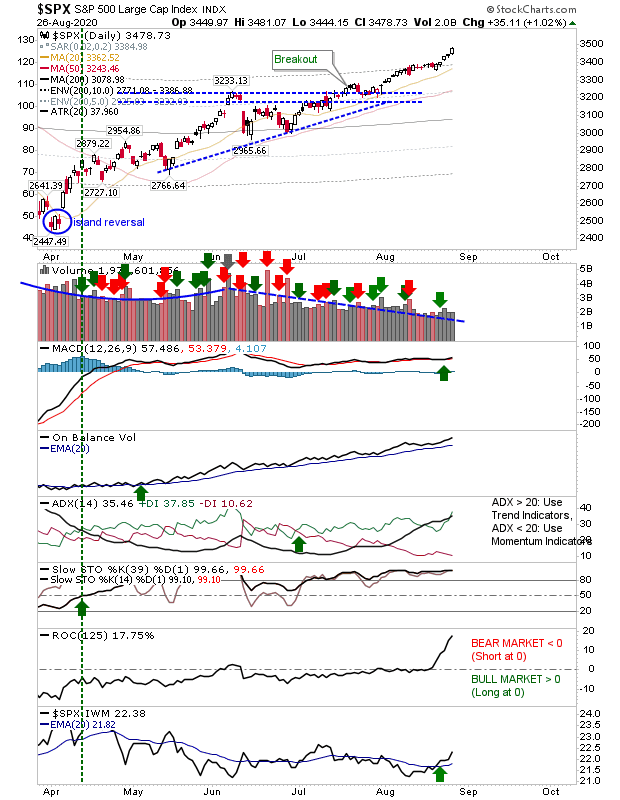
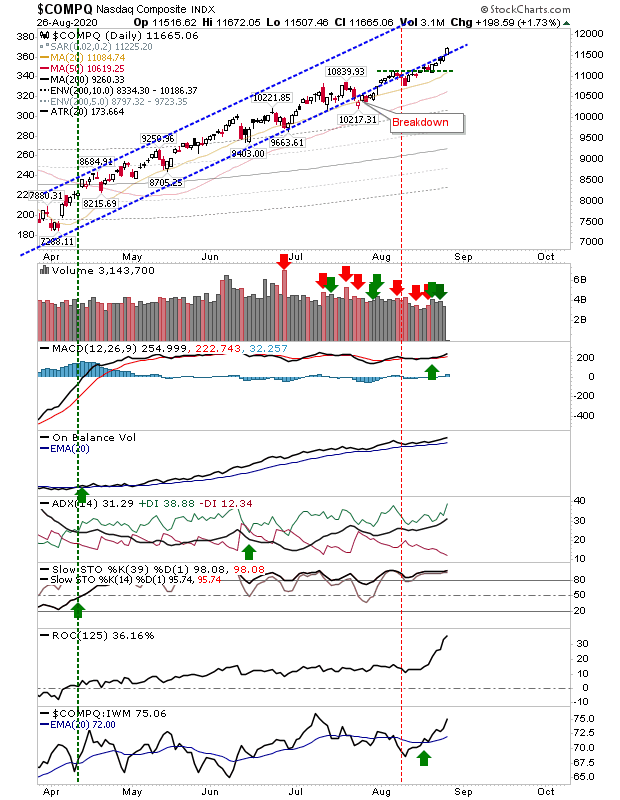
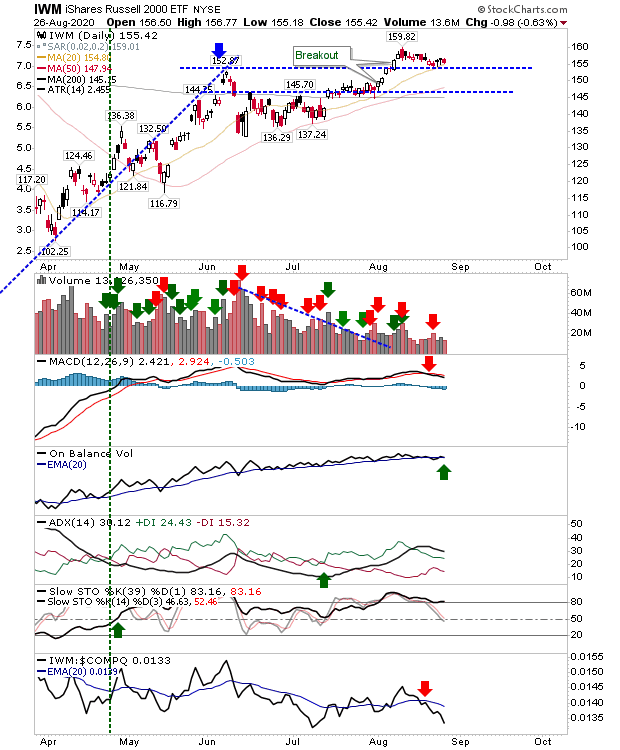
Hard to know what to make of Wednesday's action. For Large Cap and Tech Indices there was a pick up in the rate of buying, but the volume to go with the buying was below average—even allowing for holiday (COVID-19 holiday) trading. The Russell 2000 didn't manage to post a gain but didn't suffer too much damage.
The S&P 500 has moved into the 15% zone and is close to the 10% range of historic overbought price relative to its 200-day MA dating back to 1950. The last time it was this overbought was February 2020, and before that it was January 2018; both times were soon followed by periods of downside (back to the 200-day MA at the very least). Supporting technicals, including relative performance to the NASDAQ and Russell 2000, are strongly moving in bulls favor so we have very little in the way of early warning that weakness is coming so we should pay attention to relative performance to the 200-day MA metric.

The NASDAQ rallied back inside its prior upward channel and is in the 5% zone of historic price action dating back to 1971; the NASDAQ is 25.9% above its 200-day MA and if it gets to 29.3% it would be in the 1% zone of historic overbought price action. For the record, the last time the NASDAQ was this overbought was July 2009. This might be a positive given how this reaction followed the credit crisis crash bounce recovery, and the current reading is following a COVID-19 bounce, but typically this is not a positive scenario.

The Russell 2000 (via iShares Russell 2000 ETF (NYSE:IWM)) was the only index doing its own thing. Nothing fancy as it lingers near breakout support. The index is the ugly duckling as few seem interested in buying Small Cap stocks. It's also not overbought and is a long way from doing so.

Rallies continue but the end is closer to the beginning. I would be looking at covered calls or outright profit-taking for index trades in the QQQ or SPY.
