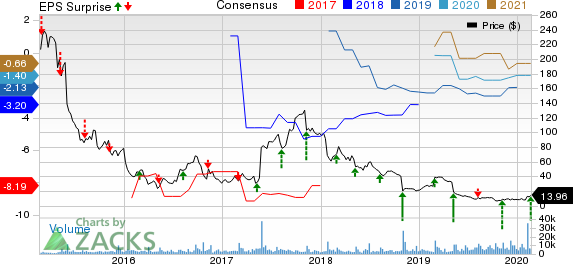
Puma Biotechnology, Inc. (NASDAQ:PBYI) incurred a loss of 29 cents per share in the fourth quarter of 2019, which was narrower than the Zacks Consensus Estimate of a loss of 48 cents as well as the year-ago loss of 80 cents per share.
The loss per share includes an impact of stock-based compensation expense. Excluding such impact, adjusted earnings per share were 1 cent per share versus a loss of 32 cents in the year-ago quarter.
Total revenues consisted of net product revenues from the sales of Nerlynx, Puma Biotech's only marketed drug, and license and royalty revenues. In the fourth quarter of 2019, total revenues were $62.9 million, comprising $58.7 million of product revenues from Nerlynx, $0.2 million of royalty revenues from licensing partners and license revenues of $4.0 million. Sales beat the Zacks Consensus Estimate of $57.0 million but were lower than the year-ago figure of $71.1 million.
Nerlynx is indicated for extended adjuvant treatment of HER2-positive early stage breast cancer in patients, previously treated with Roche’s (OTC:RHHBY) Herceptin-based adjuvant therapy.
Sales of Nerlynx declined 3.9% year over year but rose 9.7% on a sequential basis. Nerlynx’s bottle volumes rose 5% sequentially in the quarter. However, new prescriptions declined 16.5% sequentially in the quarter while total prescription declined 3.3% due to lower patient enrolments during the Christmas holiday season.
Nerlynx was approved in Argentina, Singapore and Hong Kong in the quarter where it will be marketed by its partners, Pint Pharma, Specialised Therapeutics Asia and CANbridge, respectively. Puma Biotech will receive royalties from the sales of Nerlynx in those territories once they are commercialized.
Total operating costs in the quarter were $71.6 million, down 20.2% year over year. Research and development expenses (including for stock-based compensation expense) were $31.3 million in the quarter, down 23.7% from the year-ago period. Selling, general and administrative expenses (including for stock-based compensation expense) declined 21.3% year over year to $30.2 million.
2019 Results
Full-year 2019 total revenues were $272.3 million, up 8.5% year over year. Revenues beat the Zacks Consensus Estimate of $266.7 million. Total revenues included product revenues of $211.6 million, up 5.5% year over year.
Loss per share was $1.95 in 2019, which was narrower than the Zacks Consensus Estimate of a loss of $2.14 per share as well as the year-ago loss of $2.99 per share.
Excluding the impact of stock-based compensation expense, adjusted loss per share was 47 cents per share versus a loss of 70 cents in the year-ago quarter.
Guidance
For 2020, Puma expects Nerlynx sales to be in the range of $215 million to $225 million. Meanwhile, royalties from global partners are expected in the range of $5 million to $10 million while licensing fees are expected to be in the range of $0 to $22 million.
However, Nerlynx’s sales guidance does not include any revenues from the potential label expansion for the third-line metastatic indication (NALA study).
First-quarter 2020 net product sales are expected to significantly decline sequentially due to the impact of seasonality, which resulted in lower patient enrollments during the holidays and higher inventory levels at customers in fourth-quarter 2019. First-quarter 2020 Nerlynx sales are expected to be between $40 million and $42 million.
Despite the earnings and sales beat, the stock was down 10.3% in after-hours trading on Thursday probably due to the poor guidance for the first quarter of 2020. The stock has declined 47.6% in the past year compared with the industry’s decrease of 1.8%.

Pipeline & Other Update
Several studies on Nerlynx targeting different types of breast cancer patient populations and in earlier-line settings are currently underway. A supplemental new drug application (sNDA) seeking approval of Nerlynx to treat third-line HER2-positive metastatic breast cancer is under review with a FDA decision expected in April this year. The sNDA was based on data from the phase III NALA study, which assessed the combination of Nerlynx + Xeloda compared to Xeloda plus Novartis’ (NYSE:NVS) Tykerb (lapatinib) for treating patients with HER2-positive metastatic breast cancer, who have failed two or more prior lines of treatments.
If the company gets an approval to include the NALA study outcome on Nerlynx’s label, it will be eligible to treat a broader breast cancer population, which can drive sales higher.
Apart from the HER2-positive breast cancer indication, Nerlynx is being evaluated for several other cancers as well, including NSCLC and other tumor types that over-express or have a mutation in HER2.
A key analysis of Nerlynx is the phase II SUMMIT basket study for treating solid tumors in patients with activating EGFR, HER2 or HER4 mutated cancers. In October 2019, the FDA approved a label update to address the diarrhea related side effects of Nerlynx. Safety information based on interim results from the phase II CONTROL study was approved to be included on Nerlynx’s label.
Zacks Rank & Stocks to Consider
Puma Biotech currently carries a Zacks Rank #3 (Hold). A better-ranked stock in the biotech sector is Vertex Pharmaceuticals (NASDAQ:VRTX) ,carrying a Zacks Rank #2 (Buy). You can see the complete list of today’s Zacks #1 Rank (Strong Buy) stocks here.
Vertex’s earnings per share estimates have moved up by 13.1% for 2020 and 11.7% for 2021 over the past 30 days. Share price of the company has increased 33.8% in the past year.
Roche Holding (SIX:ROG) AG (RHHBY): Free Stock Analysis Report
Novartis AG (NVS): Free Stock Analysis Report
Vertex Pharmaceuticals Incorporated (VRTX): Free Stock Analysis Report
Puma Biotechnology, Inc. (PBYI): Free Stock Analysis Report
Original post

