Trend Model signal summary
Trend Model signal: Neutral
Trading model: Bullish
The Trend Model is an asset allocation model which applies trend following principles based on the inputs of global stock and commodity price. In essence, it seeks to answer the question, "Is the trend in the global economy expansion (bullish) or contraction (bearish)?"
My inner trader uses the trading model component of the Trend Model seeks to answer the question, "Is the trend getting better (bullish) or worse (bearish)?" The history of actual out-of-sample (not backtested) signals of the trading model are shown by the arrows in the chart below.
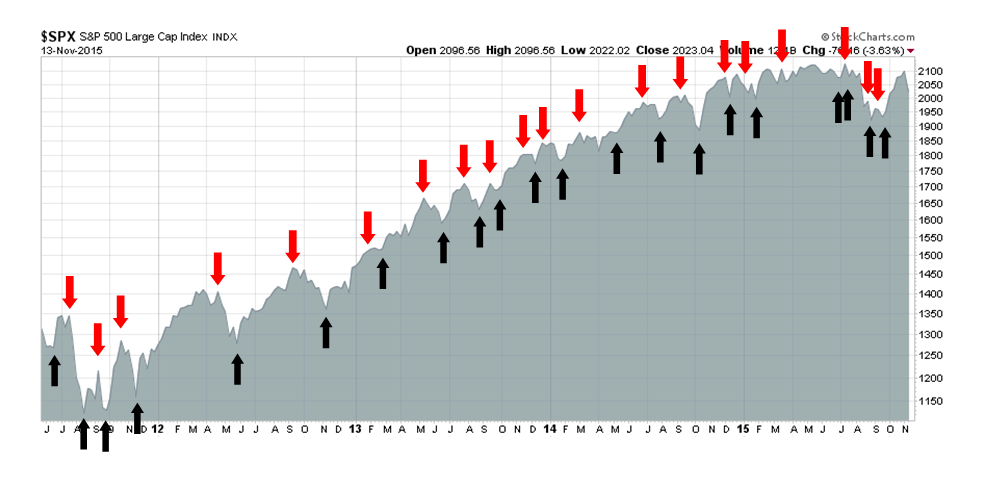
Update schedule: I generally update Trend Model readings on weekends and tweet any changes during the week at @humblestudent.
A late-cycle market
Evidence is piling up that we are entering a late cycle market. Note that I am referring to a late market cycle, which may be different from an economic cycle. In this case, however, the market and economic cycles appear to be more or less synchronized. Here is the framework that I use to describe an idealized market cycle (see The bearish verdict from market cycle analysis):
Early cycle: The economy is in recession or on the edge of a recession. In response, the central bank stimulates the economy with low interest rates (or unconventional policy). As a result, stock begin to rise, led by interest sensitive sectors, such as Financial and housing related stocks.Mid cycle: Some analysts split this part of the cycle into several pieces, but here is roughly how market expectations change. The economy gets better, or is perceived to get better. More jobs are created and consumers have more money to spend. Corporations find that they start to get capacity constrained. They respond by hiring more people, which leads to a virtuous cycle of more consumer spending, and buy more capital equipment. During this part of the market cycle, Consumer Discretionary, capital equipment sensitive sectors like Technology and Industrial stocks lead the market higher.
Late cycle: The economy starts to overheat and inflation starts to tick up. At this point, inflation sensitive commodity related sectors like Energy and Materials start to outperform. The central bank responds to rising inflationary pressures by raising interest rates, which leads to...
Bear phase: The stock market falls because of the expectations of higher interest rates and falling growth. Defensive sectors such as Consumer Staples, Utilities and Healthcare outperform during this phase.
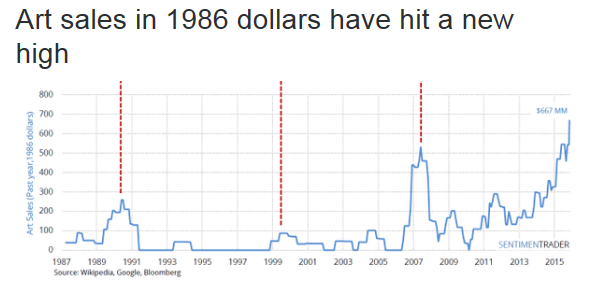
I would also add that in the late part of the expansion, excesses start to appear and sometimes begin to unravel, which is what we are starting to see today. Examples include record levels of Mergers and Acquisitions; wounded and dying unicorns and the growing sense of panic in Silicon Valley (via Luke Kawa), as exemplified by Fidelity`s 25% writedown of its Snapchat stake; and the frothiness seen in the art market.
Negative omens from the credit market
In the past couple of weeks, I have also been watching with great concern as bearish omens have appeared from the bond and credit markets. First, Tracy Alloway documented a number of uneasy signs highlighting the fragility of the bond market:
- Negative swap spreads, which is signaling a possible lack of liquidity in Treasury paper.
- Fractured repo rates, which is also a sign of limited liquidity.
- Corporate bond inventories below zero, ditto.
- Synthetic credit is trading tighter than cash credit, which is also a sign that the market is paying for liquidity in the form of tighter spreads.
- Market moves that aren't supposed to happen keep happening, which can be caused by illiquid markets failing to clear at critical periods.
- Volatility is itself more volatile.
On top of that, we are seeing signs of other excesses. Corporate leverage is rising, which is a logical response to the ultra-low rates of the last few years (via Business Insider).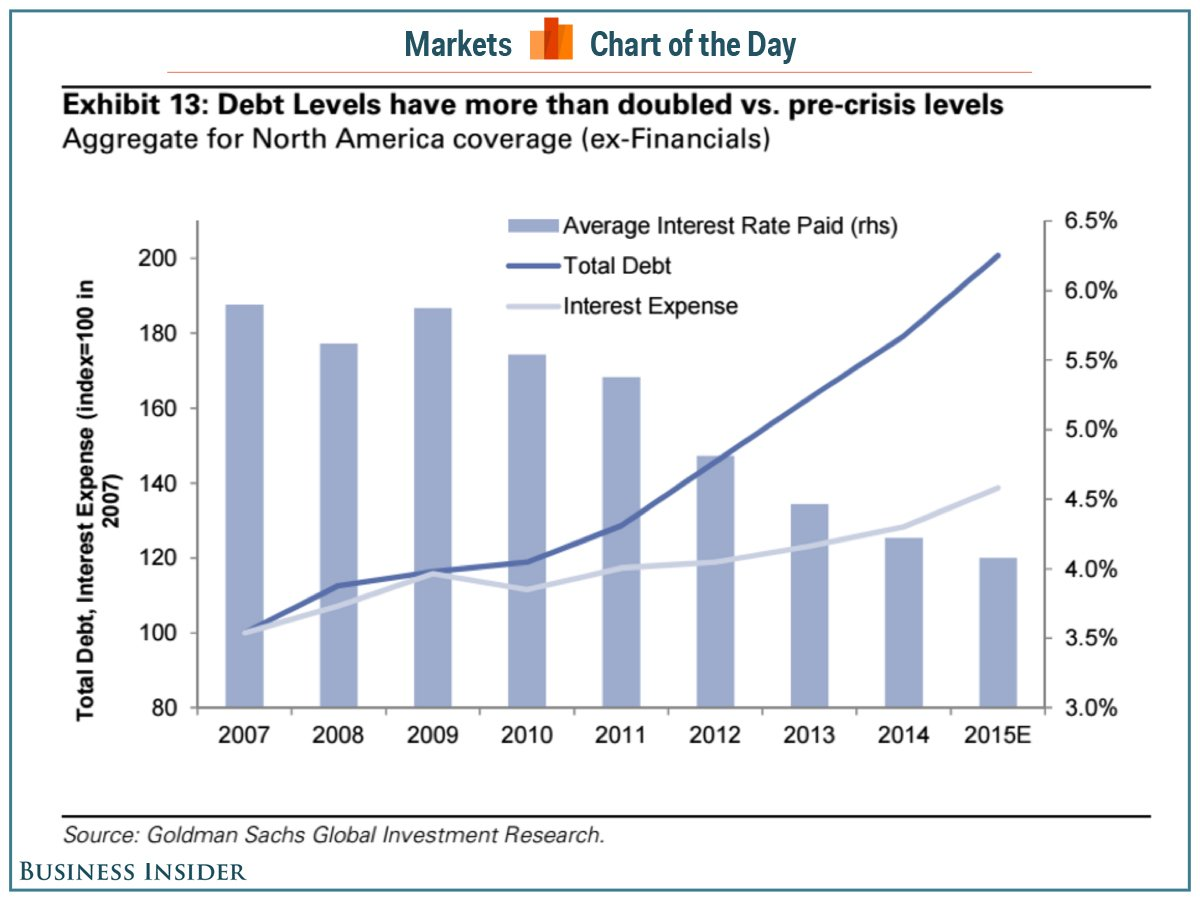
The combination of these factors are just indications that the credit markets are fragile. A good analogy might be riding around in a motorcycle at high speeds without a helmet on. Nothing will happen to you unless your crash. In that case, the outcome might not be very pretty.
The motorcycle may be approaching a twisty and bumpy road. Deutsche Bank recently sounded a warning about rising defaults, as yield spreads are starting to blow out (via Business Insider):
With the recent back-up in both IG [investment grade] and HY [high-yield] spreads to their respective 3.5-year wides, a discussion has emerged about whether the market is sensing the next default cycle around the corner or is simply “overreacting” to some exogenous but ultimately irrelevant events. At 570bp ex-energy spreads, the market is well ahead of what would normally be considered sufficient compensation for defaults that are still tracking sub-2% in this segment of our markets.
The Deutsche analysts are worried:
Strategists Oleg Melentyev and Daniel Sorid looked at six leading indicators to judge whether the credit market has over-reacted, and found that two are flashing red - meaning they are "at levels consistent with where previous credit cycles have started."
The two signals flashing red are volatility shocks, and spreads on the highest rated corporate bonds. As the chart at the bottom of this page shows, the Vix and spreads on AA-rated corporate bonds are moving in a similar fashion to the late 90s and the years leading up to the financial crisis.
Two other indicators - financial stocks and monetary policy - are flashing yellow, meaning they have shown some signs of deterioration but are not yet at stressed levels. Two other indicators - volatility in Treasuries and issuer fundamentals - are sending no warning signals.
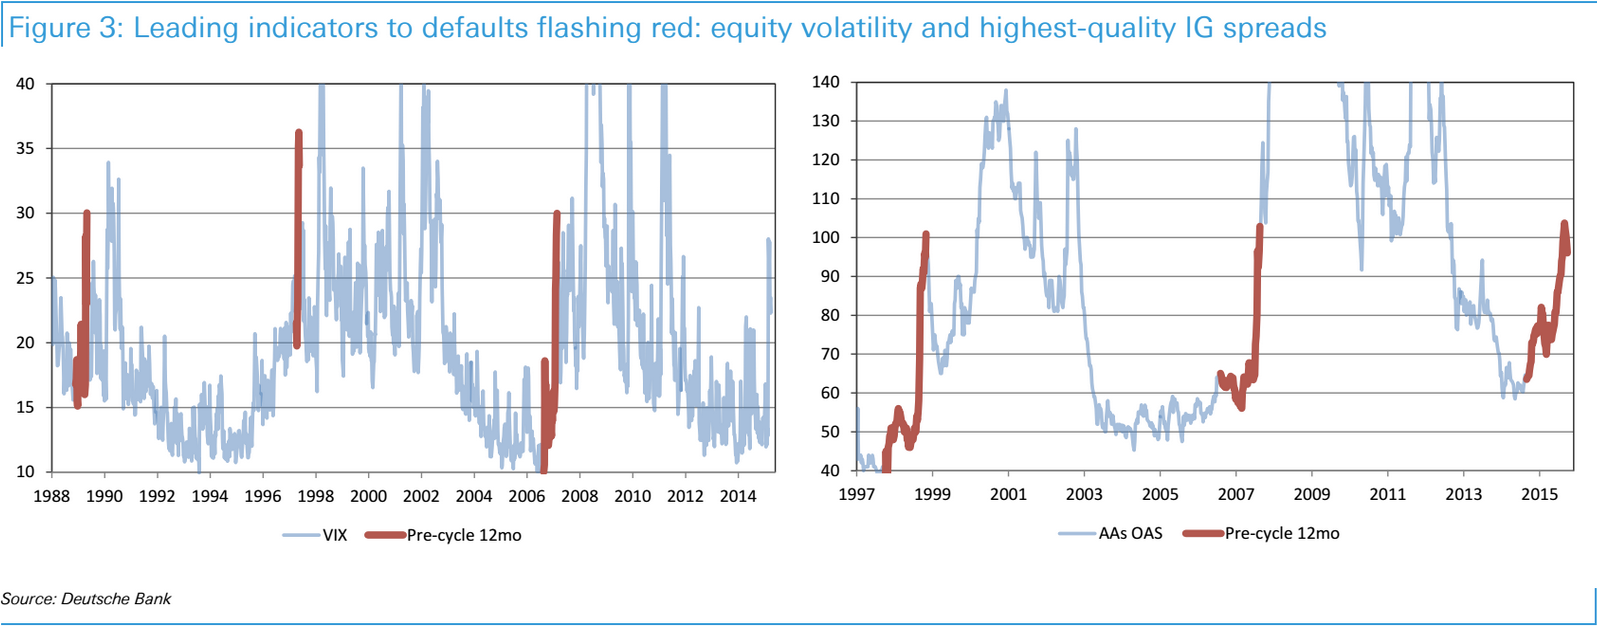
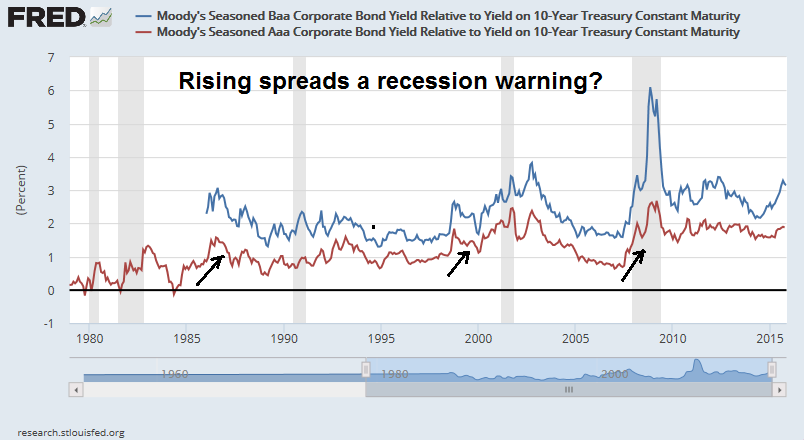
The message from the credit markets is indeed worrisome. Yield spreads are rising across all credits, from investment grade to high yield. History shows that rising spreads have been a precursor to economic recessions, which are bull market killers. However, this signal has been very early in its recession warning in two out of the last three economic cycles.
No recession on the horizon
Despite these negative signals from the bond and credit markets, I am not ready to hit the panic button yet, as there is no sign of a recession on the horizon. I am grateful to New Deal democrat for his long leading indicator framework, which he adapted from Geoffrey Moore (see his post where he outlines his methodology here). New Deal democrat monitors seven long leading indicators and only one is negative:
- Corporate bond yields (negative)
- Housing starts
- Money supply
- Corporate profits and Proprietors` income, which can be a more timely proxy for corporate profits
- Yield curve, which may not be relevant in the current ZIRP environment
- Residential real private investment
- Real retail sales
My interpretation of current conditions indicate risks are rising but we are in no imminent danger of an economic downturn. Instead, the US economy is entering the late cycle phase of the economic expansion.
Inflation is dead, long live Inflation!
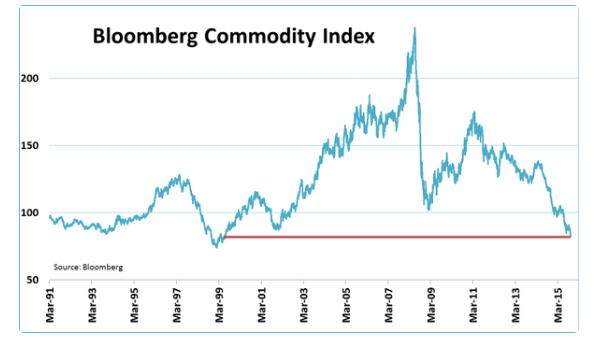
The "normal" way of playing a late cycle expansion is to rotate into the deep cyclical sectors, such as energy and mining. However, I have been seeing charts like this from last week (via Jereon Blokland) indicating that commodity prices are hitting new lows, which is undoubtedly giving many investors pause.
Is asset inflation dead, or are commodities a contrarian buy? I believe that this is setting up to be a classic contrarian value play, which can be defined as putting on a position that makes you distinctly uncomfortable. This value investment theme was reinforced by the news that billionaire and deep value investor Seth Klarman had bought a 53 million share stake in Alcoa (N:AA).
An inflection point for inflation and hard assets may be just around the corner. Goldman Sachs warned that the market is underestimating future inflation (via Bloomberg):
"The market is way too bearish on U.S. inflation in the medium term," meaning between five and 10 years, said Silvia Ardagna, an analyst in London with Goldman Sachs), one of the 22 primary dealers that trade with the Fed.
A rebound in the bond market’s inflation view would signal rising investor confidence in the Fed’s ability to increase interest rates without derailing the economy. Stronger-than-forecast U.S. jobs data on Nov. 6 backed up the case for the central bank to boost its benchmark rate from near zero at its meeting next month.
A turnaround in the inflation measure could happen quickly because the gauge is so low compared with where the bank assesses fair value -- a statistically rare two standard deviations away -- according to Ardagna.
"When an asset class in our space is this misvalued relative to its fair level estimated with our model, usually a reversal tends to be pretty fast," she said.
The 10-year break-even rate hasn’t traded at 2 percent since October 2014, when crude oil was above $90 a barrel, compared with about $42 Thursday. Investors should exit the trade if the break-even closes below 1.4 percent, according to the bank.
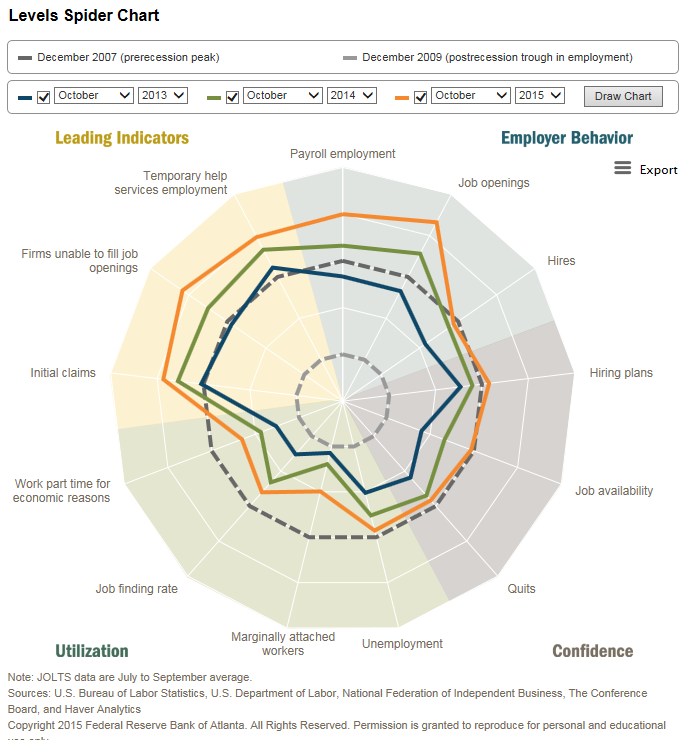
Is inflation truly dead? The Atlanta Fed's labor market spider chart shows steady improvement on all dimensions, indicating imminent wage and cost-post pressures.
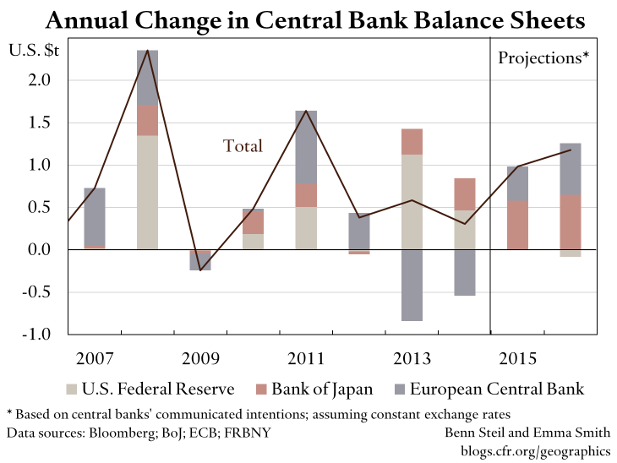
Benn Steil pointed out that despite the Fed's tightening tilt, global central banks are still adding aggregate liquidity to their balance sheets:
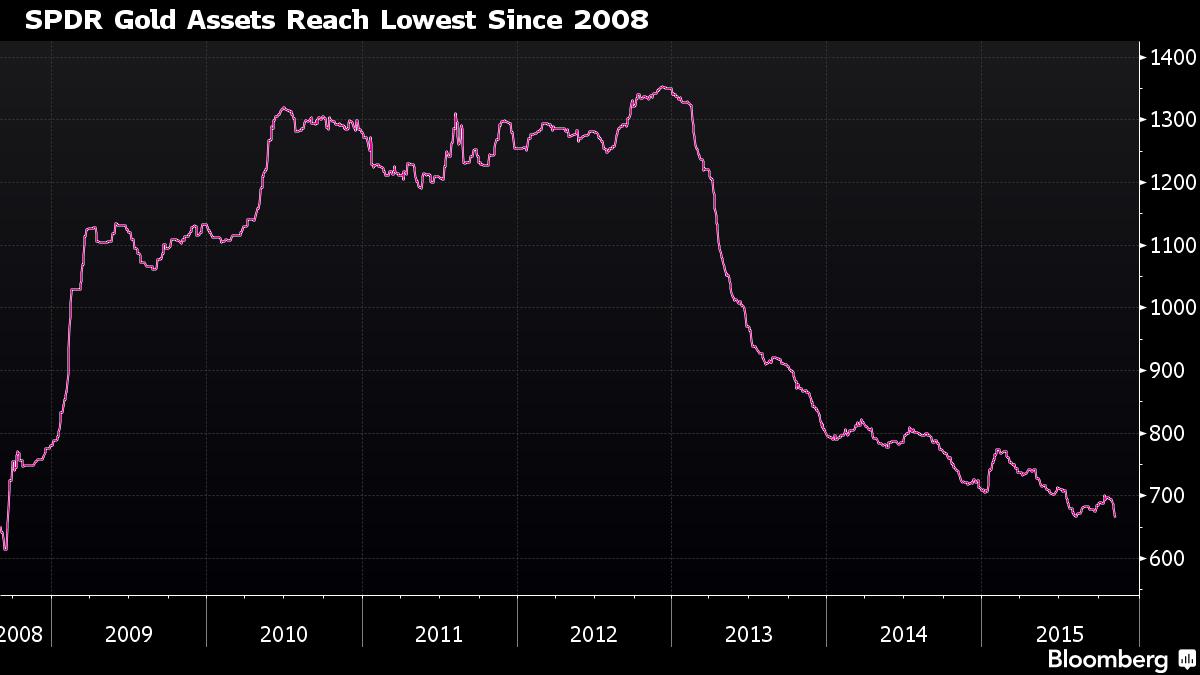
Commodities are becoming a crowded short. Meb Faber recently rhetorically asked Why You Should Ask For Coal (Stocks) In Your Stockings This Holiday Season because of how washed out they are. Bloomberg reported that SPDR Gold Shares (N:GLD) assets are hitting 2008 levels:
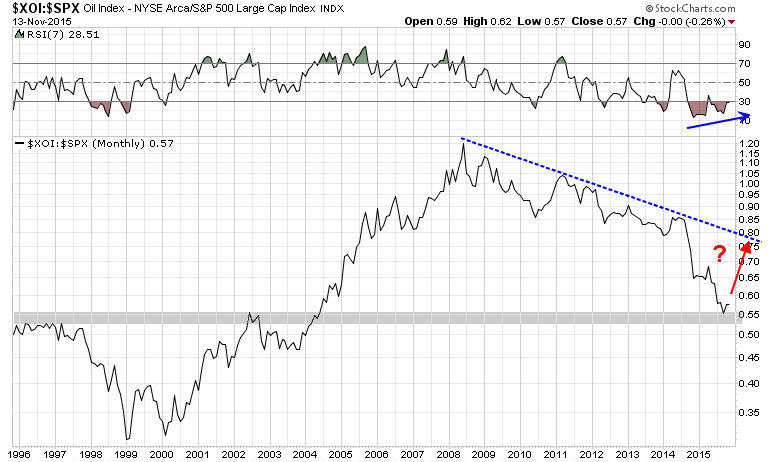
From a chartist's viewpoint, the relative performance of late cycle sectors is becoming more constructive. This 20-year relative performance chart of energy stocks (via XOI, the ARCA Oil Index) to the SPX shows that energy is testing a relative support zone with signs of positive RSI divergence.
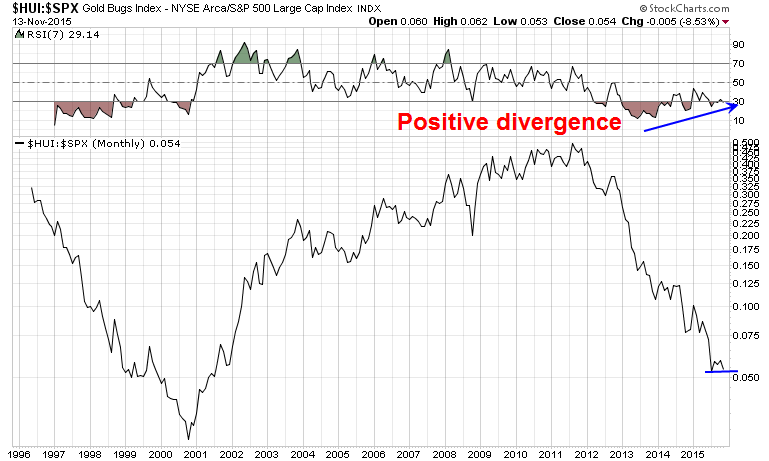
I am also seeing a similar pattern of positive divergence on the relative performance of gold stocks (via HUI, the ARCA Gold BUGS Index) as they test relative support.
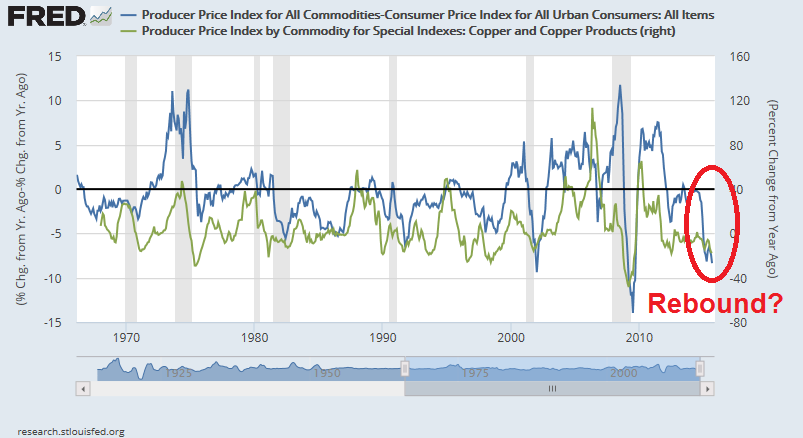
This chart of the spread of PPI to CPI (blue line) shows that it is at levels where it has historically rebounded. The green line depicts the YoY change in the important industrial commodity complex, copper and copper products, which is poised to rise.
Tom McClellan identified a 10-month cycle in copper prices (ht Jeff Miller), indicating that the red metal may be nearing an inflection point:
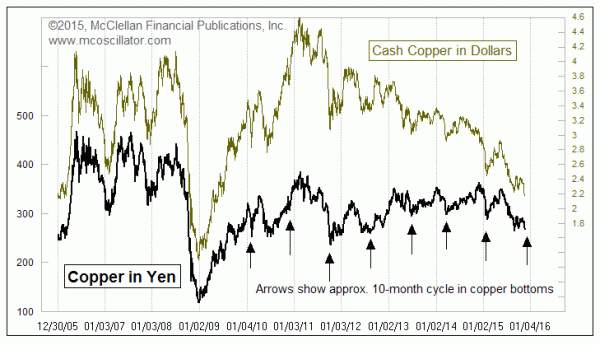
McClellan did warn, however, that copper typically bottoms with a capitulation sell-off, which is something we haven't seen yet:
The 10 month cycle in copper price bottoms says that a bottom is due imminently. But we are not yet seeing a big negative reading on the ROC to say that we have seen a washout selloff. When that washout eventually comes, there will likely be some big geopolitical or economic news to justify the selloff, and to help facilitate the washout selling wave. So when you hear that the sky is falling in the copper market, that will be the signal that the bottom is almost at hand.
When I put it all together, these late cycle sectors are getting ready to rocket upwards based on the combination of extreme negative sentiment and the benefit of an unexpected macro tailwind (also see this bullish commodity comment developed independently from Market Anthropology). Should the Fed raise rates in December, analysis from Barclays shows that energy, materials and capital goods sectors, along with selected financial stocks that benefit from higher rates, tend to outperform (via Bloomberg):
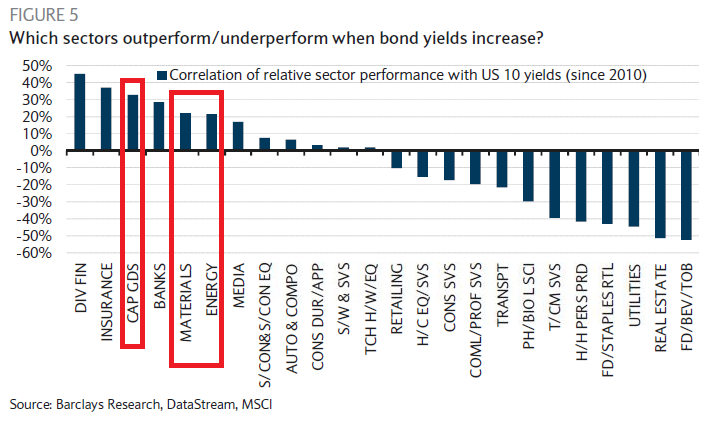
I expect that late cycle sectors like capital goods and commodity producers should be the surprise winners over the next 6-9 months. Investors should be accumulating positions now, while traders may either wait for oversold extremes or a technical breakout before buying.
The week ahead
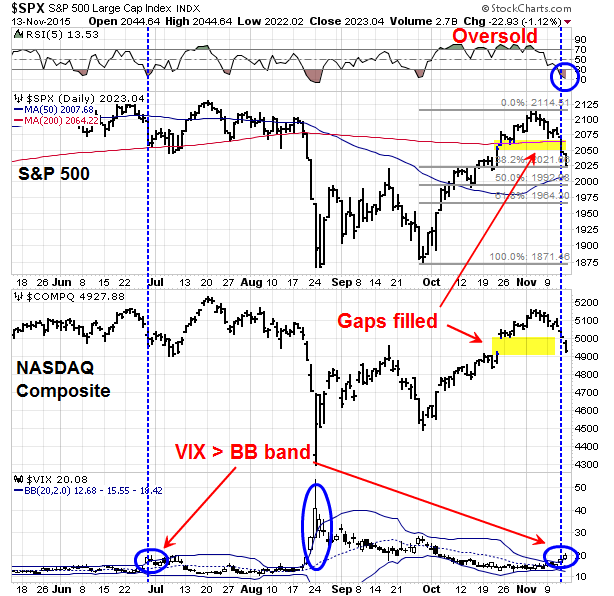
Last Sunday, I postulated that stocks would see some consolidation and pullback, which is exactly what we saw in the week (see Global reflation = Buy risk (and cyclicals)). The weakness overshot my targets, however, as I expected initial SPX support at 2055-2060 to hold.
Instead, the SPX retreated and tested the first Fibonacci retracement level of 2020. Readings are oversold on RSI5 and the VIX Index, which is now above its upper Bollinger® Band.
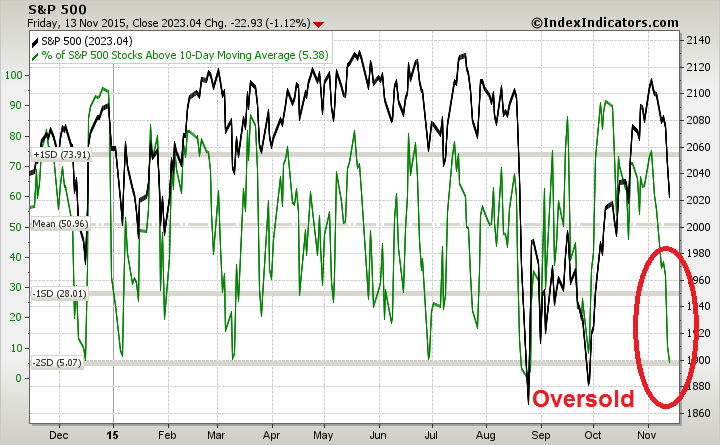
Breadth measures such as this chart of % of stocks above their 10 dma on IndexIndicators are at levels where stocks have rallied in the past. These oversold conditions suggest that any stock market weakness in reaction to the Paris attacks should be viewed as temporary and a buying opportunity.
On an intermediate term basis, I view the market action last week in the context of a breather in the wake of a Zweig Breadth Thrust, which is a powerful bullish momentum signal that lasts many months (see Bingo! We have a buy signal!).
My inner investor remains bullishly positioned in stocks. My inner trader was averaging in as the market weakened last week. He bought a small position in gold stocks on Tuesday, and SPX on Thursday and added to his long energy positions on Friday.
Disclosure: Long SPXL, NUGT, ERX
Cam Hui is a portfolio manager at Qwest Investment Fund Management Ltd. (""Qwest""). This article is prepared by Mr. Hui as an outside business activity. As such, Qwest does not review or approve materials presented herein. The opinions and any recommendations expressed in this blog are those of the author and do not reflect the opinions or recommendations of Qwest. None of the information or opinions expressed in this blog constitutes a solicitation for the purchase or sale of any security or other instrument. Nothing in this article constitutes investment advice and any recommendations that may be contained herein have not been based upon a consideration of the investment objectives, financial situation or particular needs of any specific recipient. Any purchase or sale activity in any securities or other instrument should be based upon your own analysis and conclusions. Past performance is not indicative of future results. Either Qwest or Mr. Hui may hold or control long or short positions in the securities or instruments mentioned.

