The focus today has been on the latest development in fixed income with the 2-year Treasury Yield rising above the 10-year Treasury Yield. This is an input in many economists' recession models and provides insight into the sentiment of the bond market. While my focus isn’t on the implications of the inversion, what I care about is what happens to the equity market when the curve inverts. In March I wrote about the prior inversions of the 3-month and 10-year inverting, noting the results are mixed but many times the equity market continued higher.
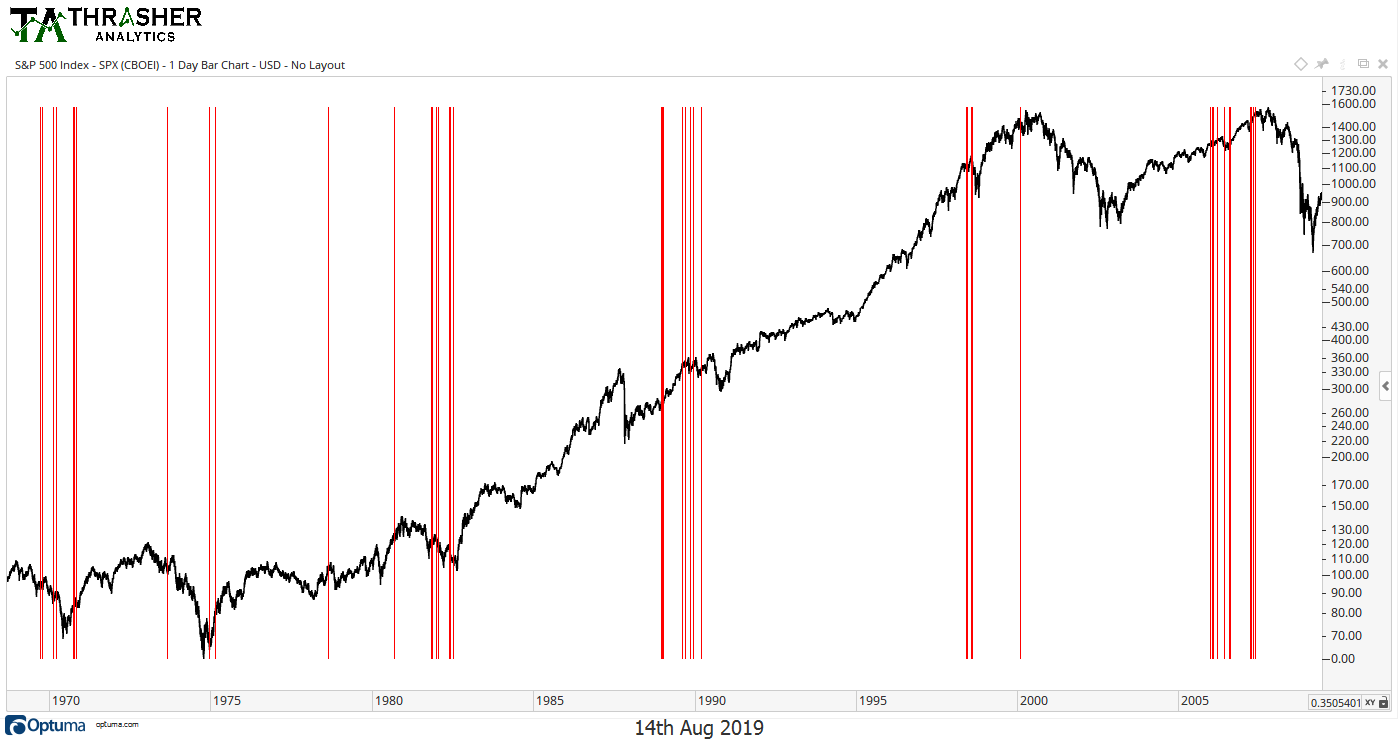
First let’s look at all the prior times the 2 year crossed above the 10 year since the 1970s. This obviously hasn’t occurred since 2007, but it did flip well before the market peaked and kicked off the GFC.

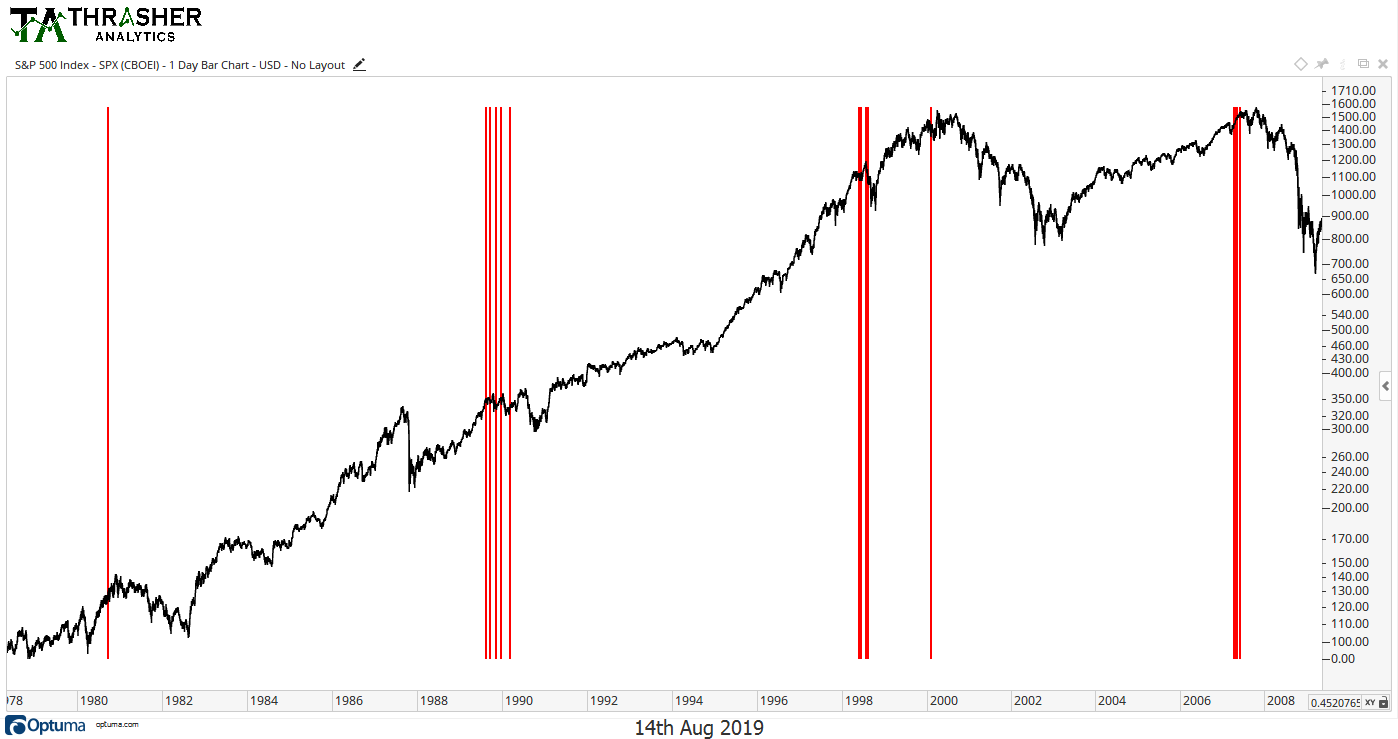
Next lets filter the results down to when the S&P 500 was within 10% of an all-time high. Our sample size begins to shrink quite a bit now and the picture looks a little less rosy. The ideal period of history when we last saw an inversion with stocks near an all-time high was in 1998, which also brought with it an interesting period of geopolitical history with the implications of foreign currencies taking some spotlight.

Now What?
The implication of the 2-10-year curve inverting will scare some people. The idea that it’s associated (wrong or right) with recessions will cause some investors to act emotionally. Regardless of what the actual inversion means for the market or the economy, what matters is the reaction to it. Price action will give a clear view of that reaction, giving yet another reason to stay focused on the data and not the narrative surrounding this small sample sized development.
