“Better than Goldilocks”
“Markets make opinions,” goes the old Wall Street adage. Indeed, this sounds like a nifty thing to say. But what does it really mean?
The bears discover Mrs. Locks in their bed and it seems they are less than happy. [PT]
Perhaps this means that after a long period of rising stocks prices otherwise intelligent people conceive of clever explanations for why the good times will carry on. Moreover, if the market goes up for long enough, the opinions become so engrained they seek to explain why stock prices will go up forever.
After nine years of near uninterrupted stock market gains, new opinions are being offered to explain why the stock market will be bathed in sunshine indefinitely. For example, the late-1990s term Goldilocks is again being used to describe why the slow growth, low unemployment, economy is good for stocks. Apparently, if an economy is not-too-cold, but not-too-hot, stocks can go up lots and lots.
What’s more, these days everything is so perfect that Goldilocks is no longer a good enough descriptor. This was the conclusion that JP Morgan’s Jan Loeys recently reached, no doubt after peering at a 5-year S&P 500 index chart:
“We nicknamed this world ‘Better than Goldilocks’ two weeks ago. With global growth breaking out from its 7-year range and inflation still surprisingly down, we are graduating from a not-too-hot, not-too-cold Goldilocks world to an even better one for risk assets. It will not last forever, but could easily last long enough, given past momentum in growth and inflation forecasts changes, to have a positive impact on all assets with risky ones outperforming.”

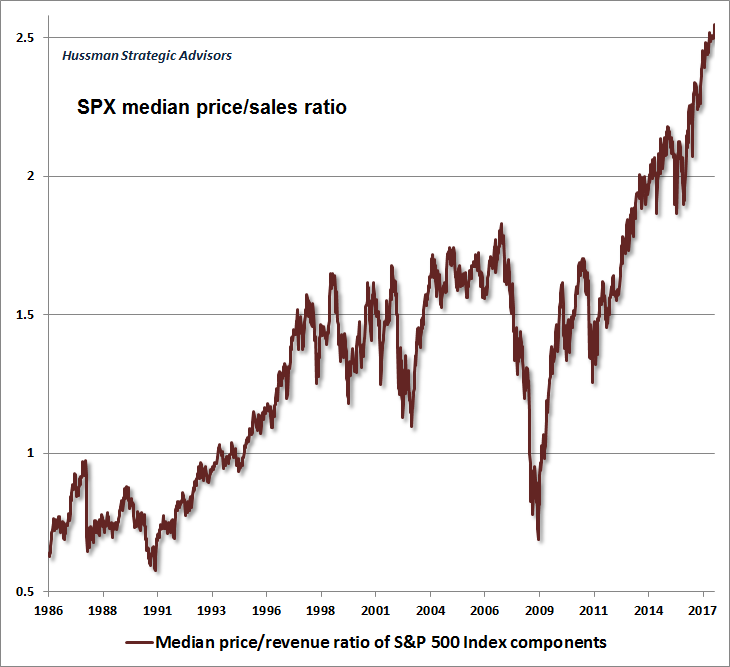
A recent update of the median price-to-sales ratio of SPX component stocks via John Hussman. What could possibly go wrong? If this chart were used in an economics course, it would probably be introduced with the words “assume perfection…”, which is what investors appear to be assuming. The “Goldilocks” argument is not entirely without merit – a weak, but not recessionary real economy and low CPI rates of change leave more “free liquidity” to be deployed in the markets – but with the recent downturn in money supply growth, free liquidity in the domestic US economy has actually turned outright negative (admittedly, we have grave reservations with respect to “measurements” of economic output and price inflation, so take this with a grain of salt). Moreover, one would think that even a perfect world will at some point be priced in. The chart above suggests that at the current juncture, a perfect world and then some has been priced in. At the same time the by far most important fundamental driver of the bubble (i.e., the pace of monetary inflation) has actually turned hostile. [PT] – click to enlarge.
Burnout, Sloth, and Apathy
Yet while Loey concedes stocks won’t go up forever, Jim Paulsen of Leuthold Group has a different market-made opinion:
“We’ve got a fully employed economy, rising real wages. We restarted the corporate earnings cycle. We’ve got strong confidence among business and consumers. The kick is we can do all of this without aggravating inflation and interest rates. If that’s going to continue, I think the bull market could continue to forever.”
Forever, as we understand it, is a very long time. Without question, Paulsen’s opinion has been molded by the market’s long running win streak. Still, a forever bull market, like an endless summer, is not without its detractions.
It’s actually pretty simple. If Mr. Grassbinder cannot live forever, then neither can the bull market. [PT]
Jay Adams, who pioneered pool skateboarding in the mid-1970s, once commented that he “was on summer vacation for 20 years.” This, alas, turned out to be more of a curse than a blessing. By the time Jay turned 40 year’s old he looked exhausted. And at just 53 his heart ran out of gas.
We’ve discovered where Jim Paulson is hanging out… that explains a lot. [PT]
Like an endless summer, a forever bull market is a misleading prospect. If it charges too hard and fast it will burn itself out and suffer a quick death. If it proceeds at a moderate pace it will lead to sloth, then apathy, while setting itself up for an even greater fall.
Stock buyers have been conditioned by years of easy gains to believe they live in a world without risk. They’ve become complacent. What to make of it?
The Goldilocks effect as it is experienced in daily practice. [PT]
How to Prepare for Another Market Face Pounding
There are certain endeavors in this world that offer little upside for their underlying risk. For instance, taking on $100,000 in student loan debt to pay for a bachelor’s degree in art history is a losing trade. So, too, is giving a Hells Angels biker the middle finger in return for a face pounding.
All summer long, investors have been giving risk the middle finger without consequence. As of Monday, the S&P 500 had gone 13 consecutive days without moving more than 0.3 percent in either direction. Based on data going back to 1927, this has never before happened.
The market’s problems may be more profound than we thought… [PT]
Yesterday, however, investors received a face pounding. The prospect of a nuclear missile exchange with North Korea overwhelmed investor complacency – or maybe it was something else, who knows? But what we do know is that the S&P 500 dropped 1.45 percent and the Nasdaq dropped 2.13 percent.
Suddenly, something impossible happened. Fear returned to the market for the first time since the presidential election. Here are the particulars:
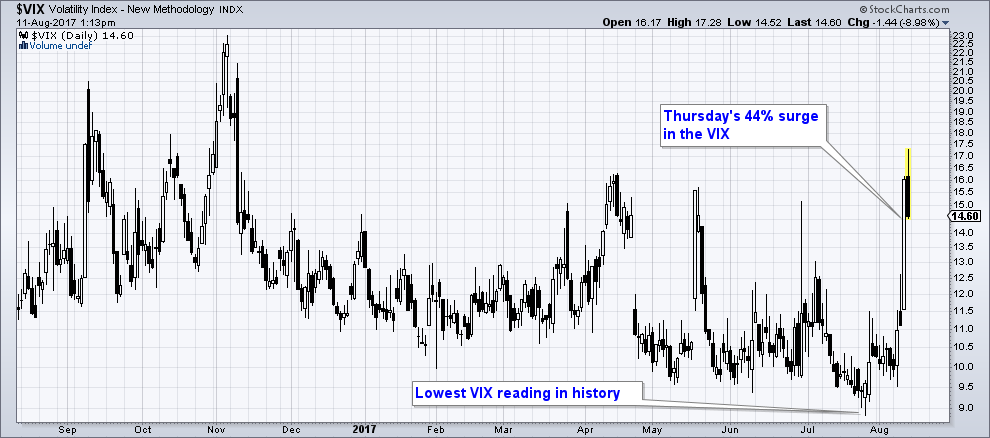
“The CBOE Volatility Index VIX, or VIX, jumped about 44 percent to 16.04. That’s still below its historical average of around 20, but underlines an escalating sense of trepidation around global events. At the least, it may be reflecting growing expectations a stock market that’s knocked out repeat all-time highs without much of a break may be primed for a substantial downturn. Thursday’s rise in the VIX represents its highest level since November 8 when it hit 18.74, and its sharpest single-session climb, also since May 17, when it jumped 46 percent, according to Fact Set data.”

Recently the VIX (a measure of the implied volatility of a range of $SPX options) fell to less than 9 points intraday, which was a new all time low. To this it should be noted that there is a huge speculative net short position in VIX futures, as well as a plethora of other types of market exposures that are closely tied to the level of the VIX. A further rise in the VIX could well trigger a cascade of selling all by itself (we strongly suspect that the VIX was a major driver of the August 2015 sell-off, or rather, exacerbated it a great deal). This is a gauge investors and traders need to watch very closely these days. In early trading on Friday, things looked slightly better again for stock market bulls after a heroic stick save by the Amazing Dennis – who seems to be a kind of famous Anti-Zoltar . [PT] – click to enlarge.
Perhaps, yesterday was just a minor hiccup as the market marches onward and upward. But we wouldn’t bet on it. The potential upside doesn’t justify the underlying risk. At the very least, stiffen your chin, grit your teeth, and prepare for another market face pounding.
