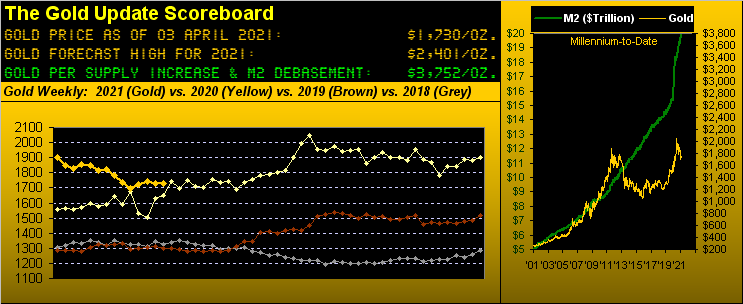
In settling the abbreviated trading week on Thursday at a price of 1730, Gold's net change from the prior Friday was but -1 point.
But here's the real but: Gold's trading range for the week initially ran from 1733 down to 1677, and then back up to 1732—boo boo bee doo, you Short April Fool. That's a 55-point positive reversal through which true Longs survived, but shallow Shorts died. 'Tis once again exemplary as we've on occasion put forth these many years that "Shorting Gold is a bad idea." And the recovery off the week's low was fierce against the frail Shorts, price therein leaping 34 points within just six hours on 31 March: "Got Gold to show in your portfolio for the Q1 close?" Darn tootin' you do!
But wait, there's more: The cumulative contract volume on the way down (across 38 hours) was 75,760. The cumulative contract volume on the way back up (across 54 hours) was 370,239. Thus with the Sellers in charge, an average of 1,994 contracts traded per hour; but when the Buyers then took charge, an average of 6,856 contracts traded per hour. Buyers win by 3.4x. Right now, the Buyers own the trading volume ... Ready for higher Gold prices?
This remarkable week of resiliency for Gold really fuels our recent reckoning that price is setting a near-term course for 1800. 'Course, 'twas all obscured within the FinMedia, the overwhelming focus there instead being on the S&P 500 eclipsing the 4000 level, at which moment we sent the following one-liner to our Investors Roundtable: "S&P 4000 ... 'Live' P/E 74.9x ... Lord have mercy ..."
Suicidal stock market insanity. From 1987-to-date, we've been through all the major S&P 500 crashes, none of which remotely were preceded by such pricing excess relative to earnings as we have today. And with the next debacle in the inevitible balance, metaphorically to again quote Gabor Vernon in the role of Borchoi, ('Octopussy', United Artists/Eon Productions, 1983): "Be at least 25 miles away when it goes off."
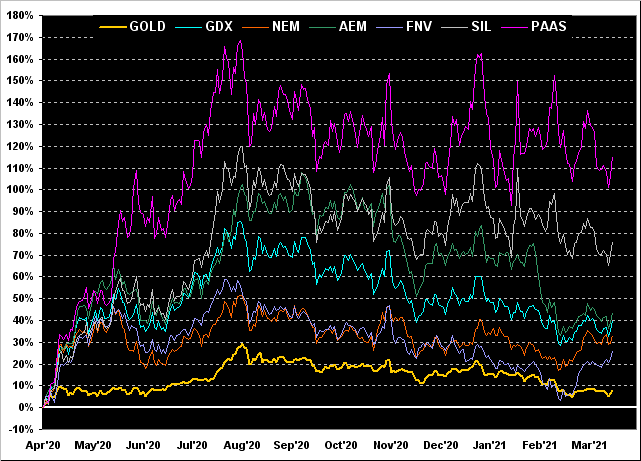
Now as 'tis month-end, (plus one full trading day), let's go straight to this eye-opening graphic of the percentage tracks from one year ago-to-date of Gold and those of its major equities brethren. This is one of these best examples we've had of the leverage inherit in metals stocks: whilst Gold itself shows as +8%, Franco-Nevada (NYSE:FNV) is +26%, Newmont (NYSE:NEM) is +33%, the VanEck Vectors Gold Miners exchange-traded fund (NYSE:GDX) is +40%, Agnico Eagle Mines (NYSE:AEM) is +43%, the Global X Silver Miners exchange-traded fund (NYSE:SIL) is +76%, and the "once-dog-now-darling" of this group Pan American Silver (NASDAQ:PAAS) is +115%.
Granted: the power of these up moves is the result of money moving into the metals just after their COVID plunge during March a year ago. But the chart nonetheless highlights the leverage of the equities:
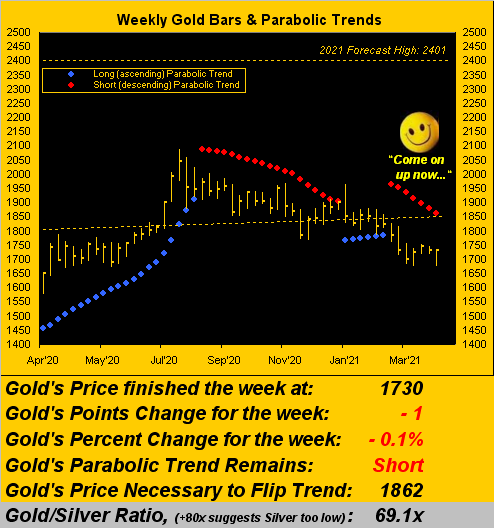
All that excitement aside, across the same time frame in turning solely to Gold's weekly bars, clearly the rightmost bar's resilience is there, its low (1677) nearly matching that of three weeks ago (1673), which as then stated may still in hindsight mark 2021's low. If so, 1800 by default (assuming the Gold market doesn't dry up) comes into play, perhaps fairly straightaway. Gold's "expected weekly trading range" is now 64 points, which in that vacuum should a "straight up week" now ensue, the high'd be 1794 in front of 1800's door:
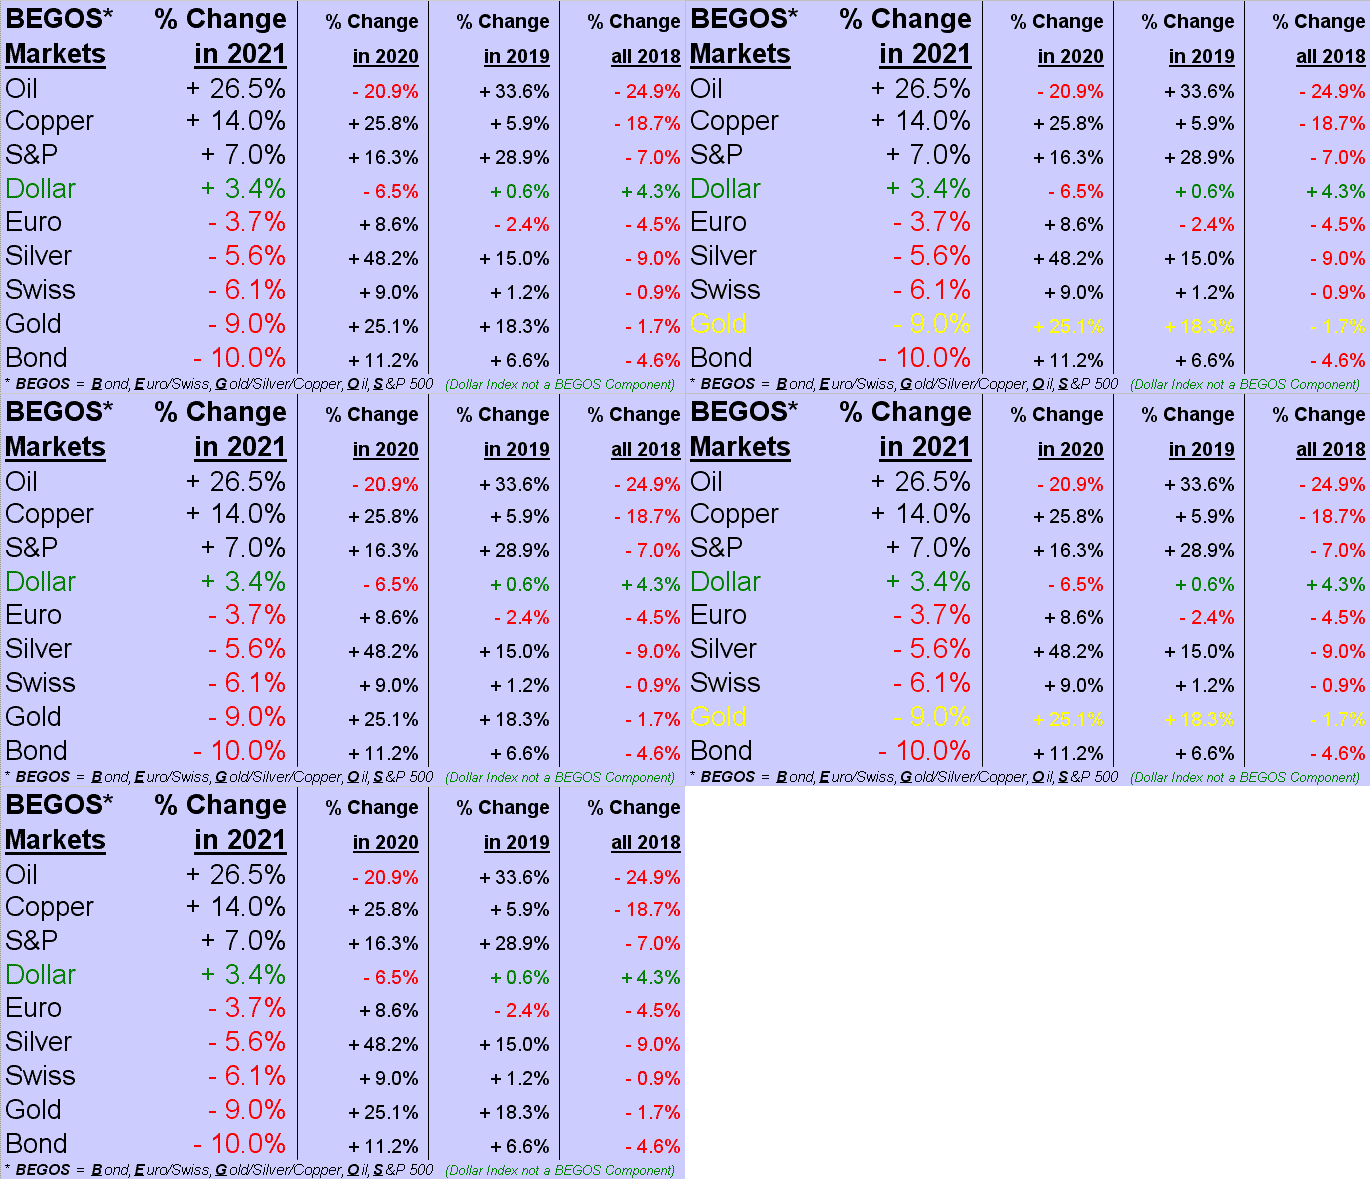
In fact, as we openly note the deteriorating diagonal slope of the dashed trendline across the above graphic, 'tis in concert with Gold actually being -9.0% year-to-date as we go to the BEGOS Markets Standings. The Bond's demise as yields rise (are you listening S&P 500?) finds the great debt instrument having replaced Gold as the cellar dweller, with Oil, Copper and the S&P on the podium in the same positions as they were when we last viewed this table at February's end. Should the year unfold as we anticipate "it ought" and Gold achieve our forecast high of 2401, 'twould then be +26.3% whilst the undoing (via the "Look Ma, No Earnings!" crash) of the S&P would find it at the bottom of the stack, having unraveled some -30%, -40%, -50%, or whatever:
Now to the economy—and for the second week running—Dow Jones Newswires points to that StateSide as "hot", indeed this time 'round stating it to be "red-hot", (as so-printed on 01 April ... thus their joke?) Either way, as we go strictly by the numbers, it doesn't look so "hot" to us ... not bad mind you, but hardly "hot":
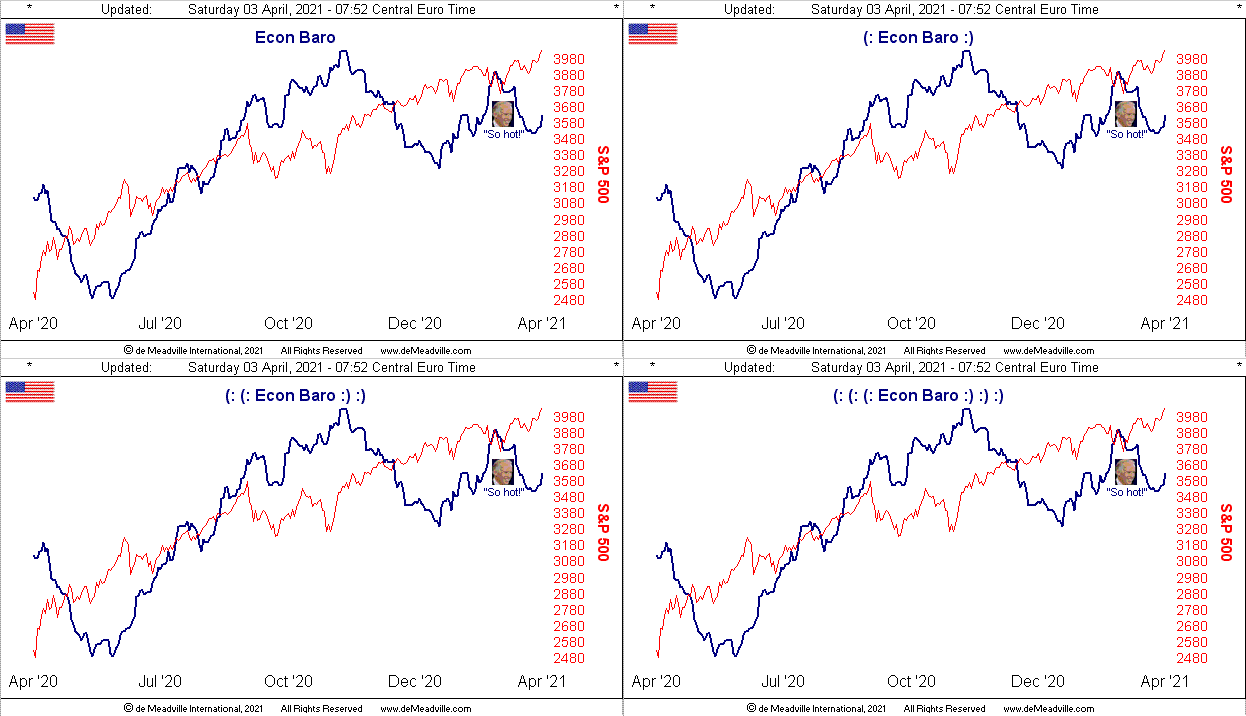
And moreover, let's repeat that from a couple of weeks back:
"...if the economy is ever allowed to reopen in full, the expected surge shan't be there, simply because the private sector has already adjusted to carrying on with business as best it can..."
To be sure, incoming metrics this past week for the Economic Barometer were positive on the various sentiment fronts and notably so for March's Payrolls increase of nearly one million jobs; however, Hourly Earnings declined for the first time since those from last June, February's Construction Spending shrank for the first time since last September, and Pending Home Sales were whacked -10.6%, their worst reading since the early depths of COVID a year ago. And up next? Income tax payments! No April Fools' joke there. And higher tax rates await! Ain't that great? At least they'll pay both for fixing the roads and the climate ... ("Whew!")
Meanwhile as France goes into a comprehensive one-month lock-down now across all of its Departments, International Monetary Fund Managing Director Kristalina Georgieva's crystal ball sees the global economy as brighter given vaccines and stimuli ... and lions and tigers ... and bears, oh my ...
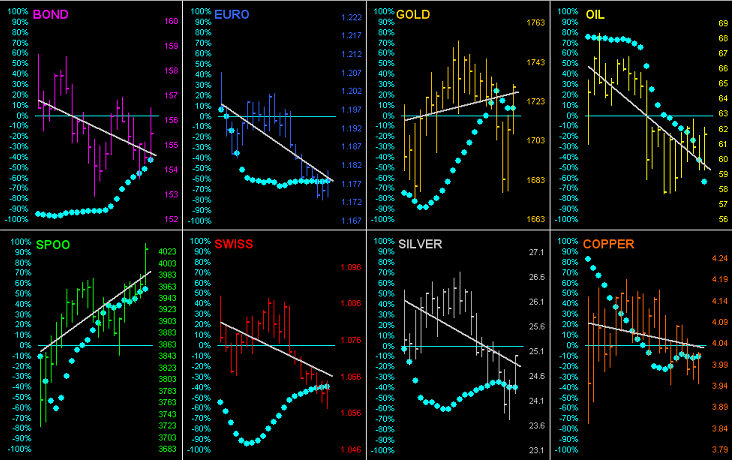
What of course bears watching are the trends of the BEGOS Markets as we go 'round the horn for the whole lot of them with this graphic of their daily bars from one month ago-to-date, diagonal grey regression trendlines, and the baby blue dots which depict each trend's consistency. Of note: only Gold and the S&P 500 ("Spoo") are at present sporting uptrends:
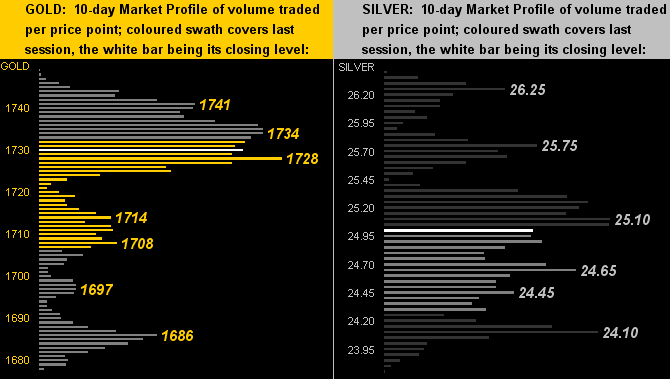
And as for the precious metals' 10-day Market Profiles, the prices of both Gold and Silver survived their intra-week dives. The yellow metal's goal now is to get above the 1730s whilst that for the white metal is to at least get comfortably above 25:
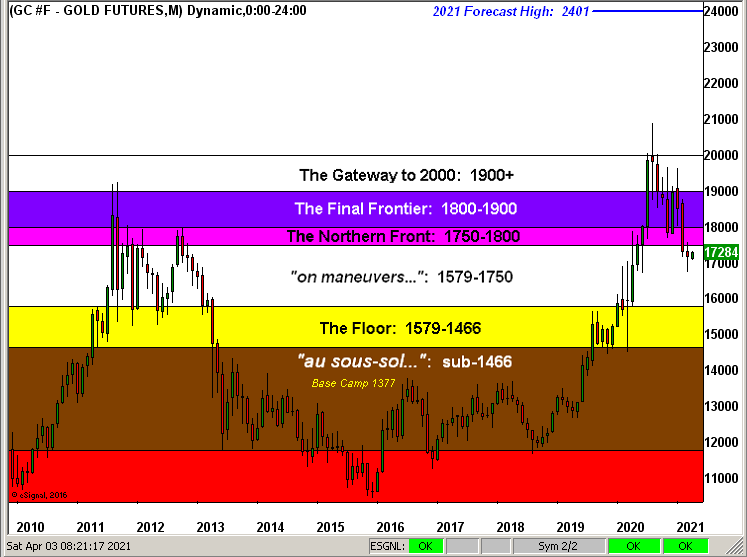
Finally, it being month-end plus, here we've Gold's structure by the month since 2010. That blue line at the top indicating our forecast high for this year of 2401 seems "a fair piece" from here; but as pointed out in recent missives, Gold—as it has done percentage-wise on numerous occasions historically—is perfectly capable of getting there within the nine months of this year's balance. And once the price of 2000 is re-achieved, that run to such high may come swiftly:
To close we've a question with respect to Normura Securities, Credit Suisse, et alia looking at equity desk losses on something to do with an Archegos Capital significant asset unwinding: yes, it does beg the obvious, but with the S&P 500 at an all-time high, how does this happen? Just askin'...
Better to jump on the volume trend and get yourself some Gold! Just sayin'...