When I don’t write as often, I have trouble re-starting. That’s because I’m not writing because I don’t have anything to say, but because I don’t have time to write. Ergo, when I do sit down to write, I have a bunch of ideas competing to be the first thing I write about. And that freezes me a bit.
So, I’m just going to shotgun out some unconnected thoughts in short bursts and we will see how it goes. Here are four:
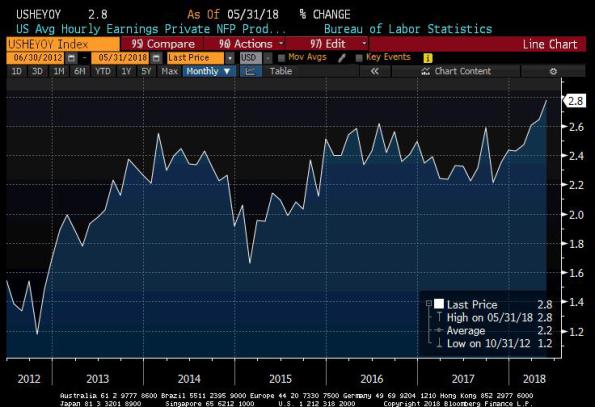
1. Wages! Friday’s Employment Report included the nugget that private hourly earnings are up at a 2.8% rate over the last year (see chart, source Bloomberg). Some of this is probably due to the one-time bumps in pay that some corporates have given to their employees as a result of the tax cut, and so the people who believe there is no inflation and never will be any inflation will dismiss this.

On the other hand, I’ll tend to dismiss it as being less important because (a) wages follow prices, not the other way around, and (b) we already knew that wages were rising because the Atlanta Fed Wage Tracker, which controls for composition effects, is +3.3% over the last year and will probably bump higher again this month. But the rise in private wages to a 9-year high is just one more dovish argument biting the dust.
As an aside, Torsten Slok of Deutsche Bank pointed out in a couple of charts on Friday that one phenomenon of recent years has been that people staying in the same jobs increasingly see zero wage growth. Although this is partly because wage growth in general has been low, the spread between wage growth for “job switchers” and “job stayers” is now about 1.25% per year, the highest rate in about 17 years. His point is that as we see more switchers due to a tight labor market, that implies more wage growth (again, the Atlanta Fed Wage Growth Tracker does a better job, so this just means average hourly earnings should increasingly converge with the Atlanta Fed figure).
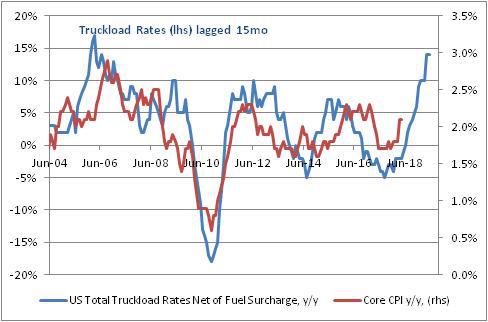
2. Truckload Rates: On Friday I was on the TD Ameritrade Network and they showed a chart that I’d included in our Quarterly Inflation Outlook (which we distribute to customers). I tweeted the chart back on May 22 but let me put it here, with some brief commentary lifted from our quarterly:

“As economic activity has started to absorb more and more unemployed into the workforce, a shortage has developed in the population of truck drivers. This shortage is not easy to overcome, since it takes time to train new truck drivers (and the robo-truck is still no more than science fiction). Moreover, recent advances in electronically monitoring the number of hours that drivers are on the road – there have been rules governing this for a long time, but they relied on honest reporting from the drivers – have artificially reduced the supply of trucker hours at just the time when more were needed because of economic growth…As a result of this phenomenon, total net-of-fuel-surcharge truckload rates are 15% higher than they were a year ago, which is the highest rate of increase since 2004. As the chart (source: FTR Associates and BLS) illustrates, there is a significant connection between truckload rates lagged 15 months and core inflation (0.74 correlation).”
According to FTR Transportation Intelligence, the US is short about 280,000 truck drivers compared to what it needs.
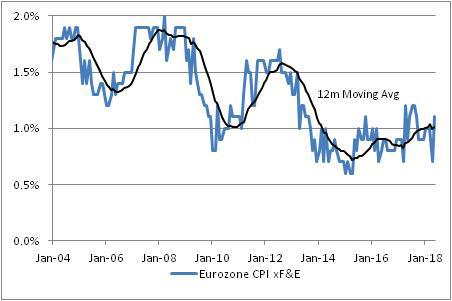
3. Eurozone Core CPI Shocks. Remember when everyone said Europe was about to head back into deflation, thanks to that surprise dip in core inflation last month? Here is what I had to say about that on my private Twitter feed (sign up here if this stuff matters to you) at the time.

I've seen a bit about how Eurozone core inflation was weka, plunging to 0.7 from 1.0. This is a seasonal glitch prob associated with Eaters. For the last 4 years the low has been let in March or April. Average jump the following month has been 0.3%.
As Paul Harvey used to say, the rest of the story is that core European CPI printed this month at 1.1%, shocking (almost) everyone for a second month.

4. Commodities Not Hot: I had a conversation recently with a potential client who said they didn’t want to get into a long-commodity strategy because they were afraid of chasing what is hot. It’s a reasonable concern. No one wants to be the pigeon who bought the highs.
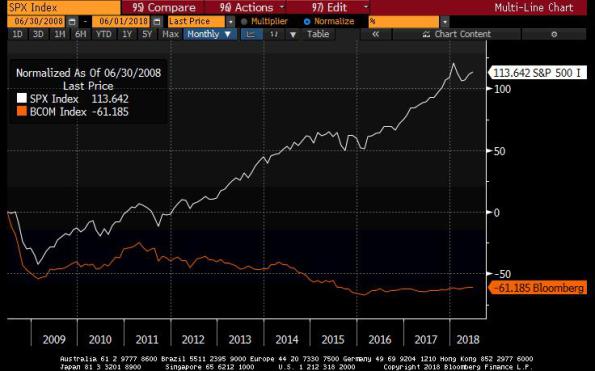
But some context is warranted. I didn’t want to be impolite, but I pointed out that what he was saying was that in the chart below of the S&P 500 vs the Bloomberg Commodity Index, he was afraid it was too late to get on the orange line because it is too hot.

Incidentally, lest you think that I chose that period because it flatters the argument…for every period starting June 30, XXXX and ending June 1, 2018, the orange line is appreciably below the white line and has never been meaningfully above it, for XXXX going back to 2002. For 2002-2011, the two indices shown here were pretty well correlated. Since 2011, it has been a one-way underperformance ticket for commodities. They are many things, but “hot” is not one of them!
I haven’t heard back.
